As many readers of this blog will know, I am a huge fan of PowerPivot, and honestly believe that this is THE most important feature to hit Excel since VBA was introduced to the product. And anyone who has ever taken a course from me knows that VBA is the greatest thing to be added to Excel since the grid was mapped into rows and columns.
For those who don’t know, PowerPivot was a free add-in to Microsoft Excel 2010, and is now baked into the Excel 2013 release. It basically allows us to pull data from different sources (multiple databases, text files, web data feeds, excel worksheets and more) into a separate layer of our file, and create relationships between the resulting tables. Basically you can aggregate data from a bunch of different sources and EASILY aggregate it into your very own business intelligence engine.
The amazingly cool part is that it’s not hard to do this. With a little knowledge about relational data (and I mean a little), and knowledge of text functions like these, you can build the columns necessary to relate your data. From there you create the table relationship (PowerPivot even tells you if you try to build it backwards), and you’re off to the races.
The results of this are, quite frankly, groundbreaking. You can then build PivotTables off this data: PivotTables that are sourced from multiple tables at once. No more massive VLOOKUP tables to build one huge data table with everything. It’s simply no longer necessary. And with the variety of sources, you can even pull in and start adding items to your pivots that you never thought of before, like the weather for example. Does your corporate database have that? I doubt it, but who cares? Just source a weather feed from the internet, relate the dates to the dates in your sales table and presto! You can now see how sales were on the sunny days in a month vs the cloudy ones.
It’s amazingly easy to get some cool stuff out of PowerPivot… at least… to a point. To over-simplify things, I’d say that PowerPivot allows you to do four overall things:
- You can source and relate tables to build your own aggregated data source (a mini BI database if you like.)
- You can build PivotTables pulling in fields from multiple tables.
- You can build OLAP formulas, allowing you to pull data for a specific element right into the worksheet, without building a whole PivotTable to do it.
- You can build super duper wickedly complex and powerful calculated fields for your PivotTables using DAX.
To me, the first three were easy. As an Excel pro with a bit of relational database knowledge, I’ve been able to work through the first 3 over the past couple of years with very little in the way of roadblocks. And by doing so, I’ve built some amazingly cool things for our company. Yet despite this, I’ve always been aware that the real piece de resistance, the part that really makes things sing in PowerPivot is DAX.
What the heck is DAX? It stands for Data Analysis eXpressions, and is the formula language that you use to create what PivotTable users know as “Calculated Fields”. It is unbelievably powerful but, without tutelage, it is unbelievably hard. For almost two years I’ve been struggling to understand DAX.
That ended this past week.
Last week I bought a bought Rob Collie’s new book “DAX Formulas for PowerPivot: The Excel Pro's Guide to Mastering DAX”. When you are ready to take the DAX journey, you MUST have this book.
Rob’s writing style is identical to that you’ll find on his blog at https://p3adaptive.com/blog/. In fact, the only difference is that he doesn’t fill up any real estate with movie quotes. 🙂 What you do get is a huge amount of insightful information.
I can honestly say that, despite being a fairly accomplished Excel pro, I have been unable to wrap my arms around DAX. But that is over. Four days of working through this book with my own data and I am now making some damn cool stuff that eluded me before.
What I love about this book is that Rob sat down and carefully thought through how an Excel pro should learn DAX, then started at the beginning. It progresses logically, is very easy to read, and actually gets you there. Yes, you need to practice, but weren’t you going to do that anyway? And when you practice…
There’s something really important between these pages that I doubt you’ll ever see in the advertising. With any programming language (yes, Excel formulas fit that bill, as do DAX formulas) there are two critical things to learn. The first is Syntax (how you do something), and the second is how to debug something. Rob gives you both, which is critical on the path to mastery. He has some nice little charts that explain how filters are applied to the CALCULATE function, (which is like SUMIF on steroids.) With those charts, you can actually follow the steps to figure out exactly why your measure is not doing what you want. (Trust me, it was doing this that actually helped me finally get that Eureka moment that I’ve been looking for!)
Four days. I’ve gone from not being able to make anything but the most simple DAX measure to the point where I can create some pretty cool CALCULATE functions (my new best friend), with nested date/time intelligent functions as well. I’ve been pursuing that for TWO YEARS!
In an hour this morning, I was able to build a nice little “Server Contest” dashboard for our food and beverage department. It has slicers to drive down into sales areas, major groups (entrees vs desserts), and dates. And it will correctly report the week-to-date, month-to-date and prior weekly sales in units, as at the selected point in time. (Previously, I was able to get the “effective date” to work, and my “current month” to work, but I could never figure out how to filter things to give me the correct month to date number if I clicked an earlier date. It always kept returning the real month to date, rather than the effective month to date.)
The dashboard is a beautiful thing (to us anyway), that we’ve never been able to produce until today:
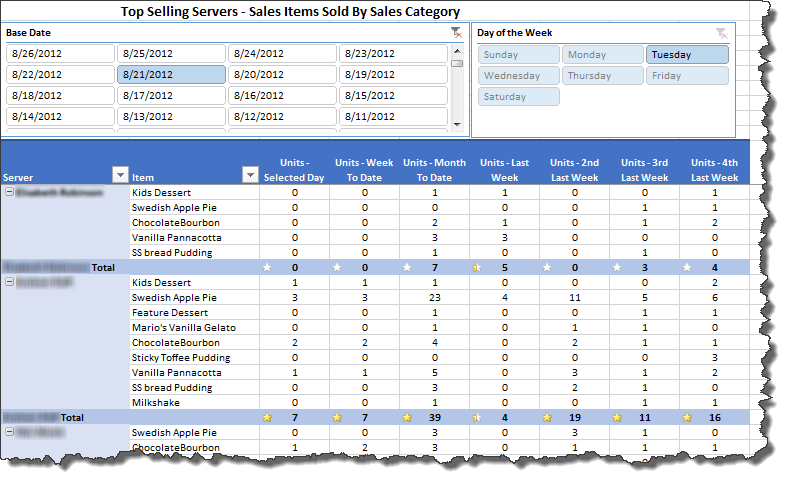
After struggling with DAX for so long, I think it’s fair to say that I wouldn’t have been able to break through this without Rob’s help. I certainly wouldn’t have been able to build the report above in such a short time.
If you’re struggling with DAX, or just getting ready to start the journey get his book. You owe it to yourself.
You can pick it up from Amazon.ca (for all my Canadian colleagues) by clicking here. If you'd prefer to deal with Amazon.com, you can get it by clicking here. Or get a digital version by clicking here.