Over the past while we've been building a Dashboard report for our golf course. It's got some historical information in it, but we've also pulled in things like weather forecasts. The intention is that our managers will be able to see where we've been over the past week, as well as look at the key measures that will allow us to staff appropriately for the next week.
We put out a prototype of the Dashboard report, and our Director of Golf said "This is cool. What's the chance we could also have the events coming up over the next week listed?"
Wow, cool. This is a great thought. Combined with the weather, this makes it a forward looking document that should be really useful.
It's not like we don't have the information, either. We have a shared Outlook calendar that we use for recording all of our events. So it's just a matter of getting the appointments out of the Calendar and into Excel. Easy, right? Ha!
Outlook has a weird way of storing appointments... especially when you get into recurring appointments. It seems that if you run code looking for appointments it ignores the recurring ones. Run the code to get the recurring appointments and it gives them to you, but with the date of the first recurring appointment, even if you select a recurring appointment from within a date range. (I pulled all appointments from 2011-04-04 to 2011-04-11, and was getting appointments from 2010!) Apparently Outlook doesn't actually store the dates of the recurring appointments at all, only the first and the recurrence pattern.
After a couple of days fighting with this, (on and off,) I happened to hit Bing looking for help. Lo and behold, I found an article by Jimmy Peña that does it all! Sweet! (Thanks Jimmy!) [NOTE: Jimmy Peña's blog is no longer available]
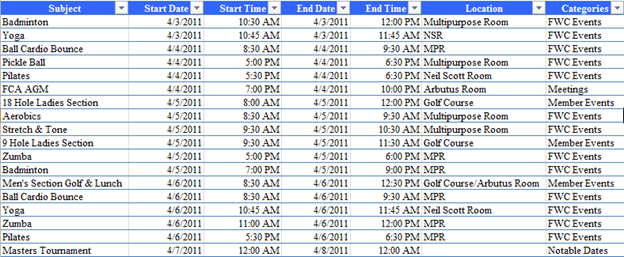
I had to make a very simple change to the article in order to make it work on a shared calendar, but that was it. Jimmy's code pulls down the key pieces I needed and places it all in a nice table:
Now, what we did with it?
I really wanted something to put on the bottom of the report that looked nice, and gave the users appropriate information. I could have pulled this into a PivotTable and put it on the report, but I didn't really like the look of it. Then I got to thinking: I like the way the slicer looks, I wonder if... So on a whim I decided to try something:
-
I created a column for each type of event I wanted to display
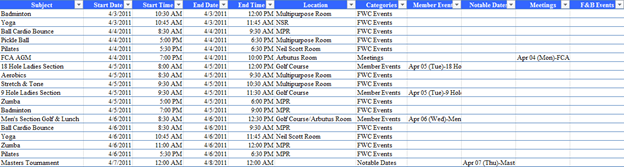
- I created a PivotTable that showed the list of events
- I added a slicer off the Pivot Table for each of the event categories at the bottom of the report
So now, I have the following to place on the bottom of my Dashboard to show the team what events are upcoming over the next week (You can picture the charts and tables above that.)

I don't think that anyone at Microsoft ever intended that someone would use slicers are the report output, but for our purposes it works.
Now, some observations here:
- I can't get rid of the blank lines. The table formulas use "" at the end of the IF statements, but they still show in the slicers. Using NA() returns #N/A in the slicers.
- One could argue that it might be better to have these grouped by date, rather than by category. We may still do that, depending on the feedback from the team.
- It's unfortunate that I had to link these to a PivotTable, I wish I could just create a slicer and give it a range to populate, like a chart
- Slicer formatting options are severely limited. You pretty much can choose a colour, to sort ascending/descending and if you'd like to shade unavailable options. (How about hide them all together?)
Granted, this may not be perfect for everyone, but I kind of like the use for this. It adds a bit of polish to our overall report, as the slicers are a bit more glamorous than a standard Excel table (with the rounded edges and all.)
I'm curious what you think of it.
8 thoughts on “An Interesting Use For Slicers”
Interesting Ken. What happens when you have a large amount of upcoming events, won't the slicers get unwieldy?
BTW, I was interested when you wrote ...Outlook has a weird way of storing appointments… especially when you get into recurring appointments. ... Apparently Outlook doesn’t actually store the dates of the recurring appointments at all, only the first and the recurrence pattern...That surprises you? How would you have done it, store them all individually?
Yeah I guess that way of storing them makes sense, but its horses for course, I guess. Its not like saving the actual data would take up a lot of room, and its more direct... I think I actually would have added them to the db as separate events, but then you have to deal with updating them etc, which is going to be less easy the other way around... horses for course... and what the hell do I know anyway...
Good old Jim! ;-), knew he would be good for somthing one of these days!?!
I like slicers, I wish you could customise them a bit more though, they always look so big. Are they exposed via VBA?
Hi guys,
Bob, because we're only looking at 7 days on the dashboard, and the slicers will hold 8 rows of visible information in this form, (7 if we leave the blank row at top,) I think we should be okay. Broken up by category like this, it would be quite rare that we would have more than 7 events in any one category in that time frame. In addition, the dashboard gets refreshed daily, and it will be the things that are a week out that wouldn't be seen, so it will work it's way through the next day.
Re the Outlook dates... I understand why they are set up as recurring appointments. What really got me is that I think there should be a collection of recurrance dates that I can look through. Currently, (if I understand it correctly,) you have to find the first date then parse the recurrance pattern to figure out if a day falls in your range. If we had a proper collection we could actually target the event much more easily using the following structure (or the FIND method).
i.e. IF Appointment("Event").Recurrances(1).StartDate=#4/4/2011# THEN ...
The existing method seems like a lot more work.
Ross, I'm just pulling stuff straight out of Outlook. The categories are all maintained there. I don't really have any need to put them into a db at all, as this info can be retrieved at any time.
In this case, it's actually the "big" portion of the slicer that I like. With the rounded bubbles, it looks like it belongs on a report and draws the appropriate attention. I do wish I had a way to hide out the blank records... I could probably do it if I created a bunch of individual pivot tables, but that does seem like overkill. Depending how irritating my users find the blanks though, I may yet still pursue that.
Odd, I posted a follow-up which seems to have been lost. I suggested that you chuck all the data in a cube and pivot it.
Strange... not even in the spam queue...
So you're suggesting stuffing it into an analaysis services cube? (As compared to PowerPivot?)
The link to the original article where you got the calendar-grabbing code isn't working anymore, and a search of that site doesn't turn up anything for grabbing an outlook calendar into excel. Can you share the original code?
And I just realized the blog post above is 5 years old. Ha!
However, I'd still be interested in seeing how you pulled that calendar in from Outlook...
Sorry Jeremy,
I can't find a link to his code, and I no longer work for the company where I implemented this. 🙁 Honestly though, today I'd use Power Query to do this anyway. Way easier to work with.