Last week I was working through creating some more DAX measures. And while I was successful, I still don't feel that I've really truly wrapped my head around how they work. (I notice that Dick Moffat feels similarly, too.)
The biggest thing that I had to wrap my head around is that Date/Time DAX functions are completely unreliable unless you bring in your own complete table of dates. Otherwise, if there is a single date missing in your table of dates, it completely blows apart the opening balance formulas. I really struggle with this: I don't have to build data tables in Excel to be able to use its date/time functions, and I'm not sure why I should need to for PowerPivot. At any rate, I built a table into a SQL database and import it along with the rest of my other tables now. I contains every single day from January 1, 2003 to December 31, 2011 at this point, so I can avoid that issue. (Our history goes back to 2003.)
Something else that struck me as odd is that, in order to create a measure I can only do it on a Pivot Table. Yet it links back to the tables in the PowerPivot data. When you create the measure, you get to pick which table stores the info.
So here's what I don't get about this. Why do I need to have a Pivot Table in place before I can kick off the "New Measure" button?
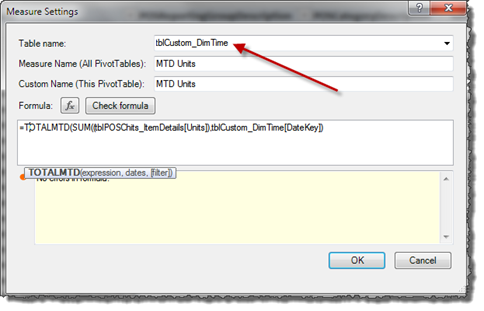
The assignment of Table name is also a bit strange... it's not a mystery, it just feels weird. I see that you've got two options:
- The DAX measure can be placed in any table provided that the columns referred to can be traced back through the relationship chain to the originating table. The problem I run into here is that when you've got 10 tables in your PowerPivot file, it can be painful to hunt down the measure definitions in the field list when you want to find them. (It also kind of defies logic to me that it doesn't need to be somewhere.)
- If you fully qualify your table names (as I have above), it seems that it doesn't matter where the heck you put them. So to keep things organized I created a linked Excel table called "tblMeasures" with one cell of data. I could then assign all of my measures to that table to keep them organized. The only issue is that I'm now stuck with the message "Relationship May be Needed". I'd sure like to be able to say "thanks, but you don't need to bother me for this table"
Ultimately though, it would be really nice to have some kind of section/filter to display the measures vs the tables/fields.
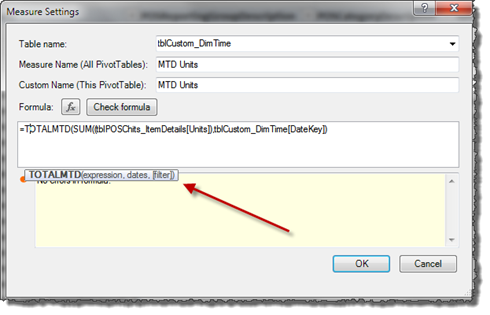
I will also say that I find the DAX editor to be somewhat wanting after the richness of the Excel UI. Maybe it's just me, but I don't find the term "expression" in the Intellisense all that helpful when you're trying to learn how to write one of these formulas. (Some kind of expression builder would be really cool, but I imagine that would also be kind of tough to implement.) The other issue I find is that these things returns tables of information, then distill pieces out by filtering, summing, etc. When you're stuck, and something isn't working out how you think it should, it is VERY difficult to see where you went wrong.
Breaking a formula up into multiple lines kills the Intellisense outright too, which is very frustrating. Once the formulas start to get complex, this is sometimes the only way to keep them legible. And the fact that the case for DAX isn't updated to all caps once committed is kind of an annoyance. I don't type in caps, but I never realized how much I appreciate Excel converting those for me. It sure makes it easier to read afterwards.
Finally why is it that every time you get a message it obscures the note in the box below?
At any rate, I'm sure I will get my head wrapped around this, it will just take time. J
2 thoughts on “Trying to Understand Measures in PowerPivot”
<<So here’s what I don’t get about this. Why do I need to have a Pivot Table in place before I can kick off the “New Measure†button?<<
The PivotTable is really the "design canvas" for creating measures. I cannot visualize creating complex measures without seeing the field values from which I'm creating a measure. I suppose in theory a PivotTable shouldn't be required to create a measure, but I would have a really hard time otherwise.
The association between a measure and an associated table is a rather loose one (unlike calculated fields created in the PowerPivot window). The table association is simply a means of displaying the measure somewhere in the field list. It is best to associate measures with tables that best "fit" the measure. For example, if the measure is based on Orders, then it's best placed in the Orders table. However, I think that the traditional OLAP field list works better.
<<Ultimately though, it would be really nice to have some kind of section/filter to display the measures vs the tables/fields<<
Agreed.
<<The other issue I find is that these things returns tables of information, then distill pieces out by filtering, summing, etc… When you’re stuck, and something isn’t working out how you think it should, it is VERY difficult to see where you went wrong.
Breaking a formula up into multiple lines kills the Intellisense outright too, which is very frustrating. Once the formulas start to get complex, this is sometimes the only way to keep them legible.<<
The only solution is to break down complex formulas into multiple measures and test each measure at a time in the PivotTable. You can then put everything into one formula after you know that each part is working correctly. I call this advance debugging 🙂 It's also a major reason why I can't imagine creating measures without having a PivotTable to work with.
Pingback: The problem of power users, DAX and difficult calculations « Chris Webb's BI Blog