"Microsoft Excel is not a spreadsheet application anymore, it’s a medium to store, present, and analyze data." - Puneet Gogia
The way Excel has evolved in the past few years, it’s almost impossible to work without it in this present world.
Apart from all the stuff you can learn to do in Excel, the thing which I love most is that I can code in it.
Once you know how to use VBA, you can create macros and automate all the activities which you do manually otherwise.
Today, I want to talk about something else. Something powerful! Let’s talk about using JavaScript (TYPESCRIPT) in Excel.
Before we get into this make sure to subscribe to Excelguru's Newsletter to get tips like this in your mailbox.
Script Lab
There’s a whole bunch of APIs which you can use and code with in your Office applications.
But, with Script Lab you can directly write and test your code into your applications. It’s an add-in which you can install from Microsoft’s App Store.
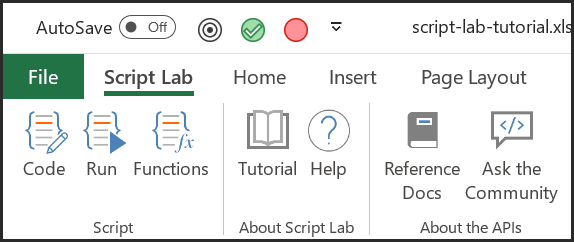
In Script Lab, there are three different sections where you can write JavaScript, HTML, and CSS code.
Create a PivotTable in Excel using Javascript
The PivotTable is one of the most useful things which you can use in Excel to summarize and analyze your data.
Even though I like using VBA to create a PivotTable, writing code in JavaScript instead is real fun. In this post I’d like to share with you how to do this.
I’ve split it into a 5-steps process and you can download the files from here to follow along:
- Insert Worksheets and Data
- Enter a Blank PivotTable
- Insert a Row
- Insert a Column
- Add Values to the Pivot Table
1. Insert Worksheets and Data
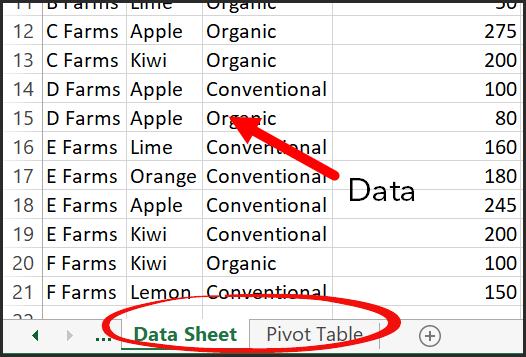
The very first thing which you need to create a PivotTable is the source data. So, first of all, you need to write the code which adds source data to the worksheet.
Below is the code:
async function setup() {
await Excel.run(async (context) => {
context.workbook.worksheets.getItemOrNullObject("Data Sheet").delete();
const dataSheet = context.workbook.worksheets.add("Data Sheet");
context.workbook.worksheets.getItemOrNullObject("Pivot Table").delete();
const pivotSheet = context.workbook.worksheets.add("Pivot Table");
const data = [
["Farm", "Type", "Classification", "Crates Sold at Farm", "Crates Sold Wholesale"],
["A Farms", "Lime", "Organic", 300, 2000],
["A Farms", "Lemon", "Organic", 250, 1800],
["A Farms", "Orange", "Organic", 200, 2200],
["B Farms", "Lime", "Conventional", 80, 1000],
["B Farms", "Lemon", "Conventional", 75, 1230],
["B Farms", "Orange", "Conventional", 25, 800],
["B Farms", "Orange", "Organic", 20, 500],
["B Farms", "Lemon", "Organic", 10, 770],
["B Farms", "Kiwi", "Conventional", 30, 300],
["B Farms", "Lime", "Organic", 50, 400],
["C Farms", "Apple", "Organic", 275, 220],
["C Farms", "Kiwi", "Organic", 200, 120],
["D Farms", "Apple", "Conventional", 100, 3000],
["D Farms", "Apple", "Organic", 80, 2800],
["E Farms", "Lime", "Conventional", 160, 2700],
["E Farms", "Orange", "Conventional", 180, 2000],
["E Farms", "Apple", "Conventional", 245, 2200],
["E Farms", "Kiwi", "Conventional", 200, 1500],
["F Farms", "Kiwi", "Organic", 100, 150],
["F Farms", "Lemon", "Conventional", 150, 270]
];
const range = dataSheet.getRange("A1:E21");
range.values = data;
range.format.autofitColumns();
pivotSheet.activate();
await context.sync();
});
}
In this code, you have a function called “setup” which does the following things:
- It will first check if “Data Sheet” and “Pivot Table” worksheets already exist, and if they do exist then it will delete them and insert new.
- Next, in the “Data Sheet” worksheet it will add a set of data that will be the source data for the PivotTable.
When you run this code you’ll have something like this in your workbook:
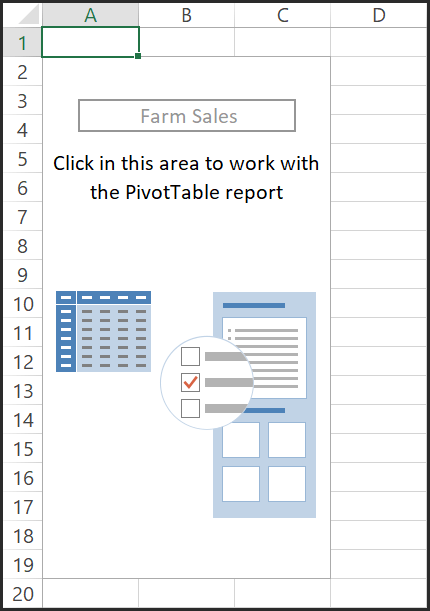
2. Enter a Blank PivotTable
When you normally build a PivotTable in Excel, it first inserts a blank PivotTable and then you have to add a row, a column, and values manually.
So now you need a code that inserts a blank PivotTable in the “Pivot Table” worksheet. (You have already written the code in the previous section to insert the “Pivot Table” worksheet.)
Below is the code for this:
async function createWithNames() {
await Excel.run(async (context) => {
const rangeToAnalyze = context.workbook.worksheets.getItem("Data Sheet").getRange("A1:E21");
const rangeToPlacePivot = context.workbook.worksheets.getItem("Pivot Table").getRange("A2");
context.workbook.worksheets.getItem("Pivot Table").pivotTables.add("Farm Sales", rangeToAnalyze, rangeToPlacePivot);
await context.sync();
});
}
Now in this part of the code, we have a function called “createWithNames” which works as follows:
- First of all, it takes range A1:E21 from the “Data Sheet” worksheet where you have the source data.
- After that, it specifies the cell A2 in the “Pivot Table” worksheet for inserting the blank PivotTable.
- Finally, it inserts a blank PivotTable.
After running this part of code you’ll have something like this in your “Pivot Table” worksheet:
3. Insert Row Label
Once you insert a blank PivotTable, the next thing is to insert rows in it. Below is the code which can do this for you:
async function addRow() {
await Excel.run(async (context) => {
const pivotTable = context.workbook.worksheets.getActiveWorksheet().pivotTables.getItem("Farm Sales");
// check if the PivotTable already has rows
const farmRow = pivotTable.rowHierarchies.getItemOrNullObject("Farm");
const typeRow = pivotTable.rowHierarchies.getItemOrNullObject("Type");
const classificationRow = pivotTable.rowHierarchies.getItemOrNullObject("Classification");
pivotTable.rowHierarchies.load();
await context.sync();
if (typeRow.isNullObject) {
pivotTable.rowHierarchies.add(pivotTable.hierarchies.getItem("Type"));
} else if (farmRow.isNullObject) {
pivotTable.rowHierarchies.add(pivotTable.hierarchies.getItem("Farm"));
} else if (classificationRow.isNullObject) {
pivotTable.rowHierarchies.add(pivotTable.hierarchies.getItem("Classification"));
}
await context.sync();
});
}
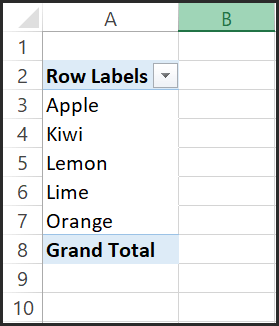
Now in this part of the code, we have a function called “AddRows” which works as follows:
- First of all, it checks if there are any rows already in the PivotTable (the first three columns of the source data would be matched one by one).
- After that (as you are considering the first three columns), it will add them as rows one by one.
As we are using an HTML button here, you can use that button to add all the three rows one by one with it. At this point, you have you’ll have a PivotTable with rows like this:
4. Insert Column Labels
The next thing is to insert columns, and below is the code which you need to use:
async function toggleColumn() {
await Excel.run(async (context) => {
const pivotTable = context.workbook.worksheets.getActiveWorksheet().pivotTables.getItem("Farm Sales");
// check if the PivotTable already has a column
const column = pivotTable.columnHierarchies.getItemOrNullObject("Classification");
column.load("id");
await context.sync();
if (column.isNullObject) {
// adding the farm column to the column hierarchy automatically removes it from the row hierarchy
pivotTable.columnHierarchies.add(pivotTable.hierarchies.getItem("Classification"));
} else {
pivotTable.columnHierarchies.remove(column);
}
await context.sync();
});
}
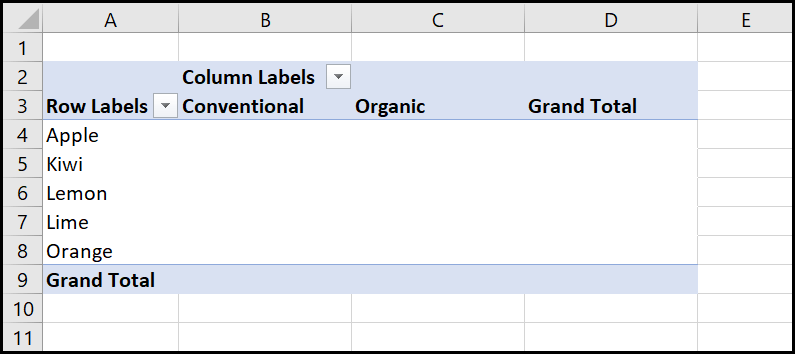
In this code, you have referred only to the “Classification” column and it works in the following manner:
- First of all, it checks if the column “Classification” is already there on not.
- If the column is not already there, then it adds it to the column label.
As we are using an HTML button here, you can add and remove the column label with this code.
At this point, you’ll have a PivotTable with rows and columns like this:
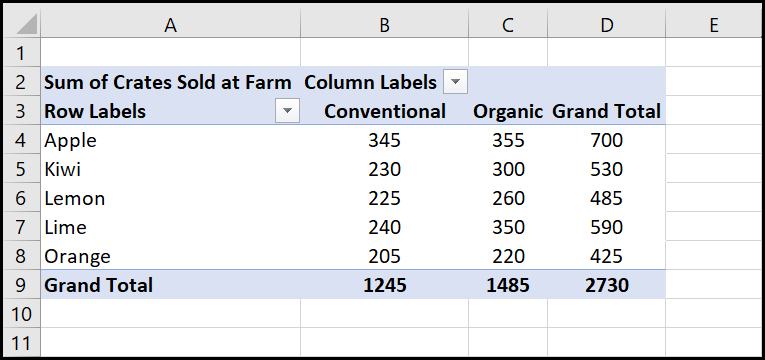
5. Add Data Values
The key thing in a PivotTable is the values, and with the below code you can add these in:
async function addValues() {
await Excel.run(async (context) => {
const pivotTable = context.workbook.worksheets.getActiveWorksheet().pivotTables.getItem("Farm Sales");
pivotTable.dataHierarchies.add(pivotTable.hierarchies.getItem("Crates Sold at Farm"));
await context.sync();
});
}
/** Default helper for invoking an action and handling errors. */
async function tryCatch(callback) {
try {
await callback();
} catch (error) {
// Note: In a production add-in, you'd want to notify the user through your add-in's UI.
console.error(error);
}
}
In the source data, you have two different columns where you have values:
- Crates Sold at Farm
- Crates Sold Wholesale
But here in this code, you have only one column to use as values: the "Crates Sold at Farm". However, you can change it or even use both of the columns as well.
And your completed PivotTable is here:
How to Add this Code into Script Lab
As I have already mentioned, you can also use HTML and CSS in the Script Lab to create a side-pane where you can run and test your code.
Note: In the code, stored on GitHub, I have added a small bunch of code lines to handle errors, here is the download link.
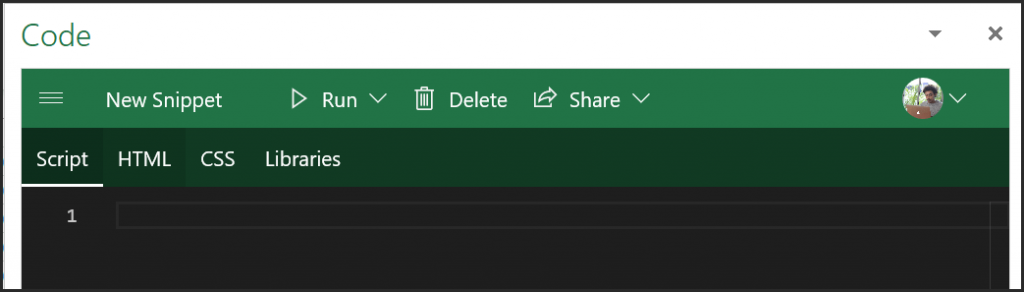
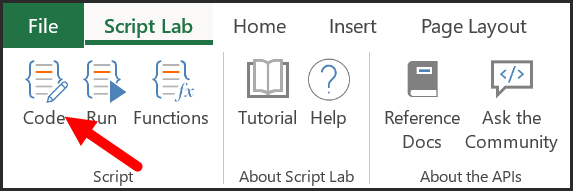
Make sure to install the Script Lab add-on and then follow the below steps to enter this code into the Script Lab:
- First of all, click on the Code button on the Script Lab tab to open the Code Editor.
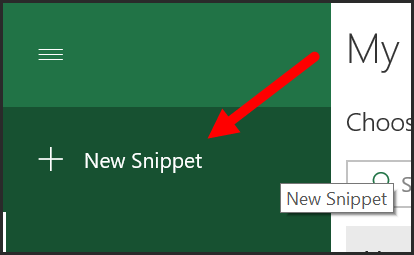
- After that, click on the Menu button and select New Snippet.
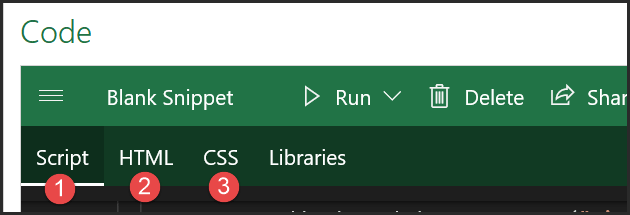
- Next, you need to add JavaScript, HTML, and CSS into the Script (1), HTML (2), and CSS (3) tabs respectively.
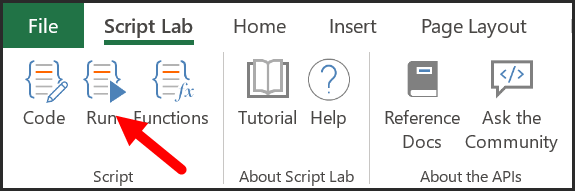
- From here, you need to run the code. For this, you need to click on the Run button from the Script Lab tab.
Once you click on the Run button, the side pane appears, just like below:
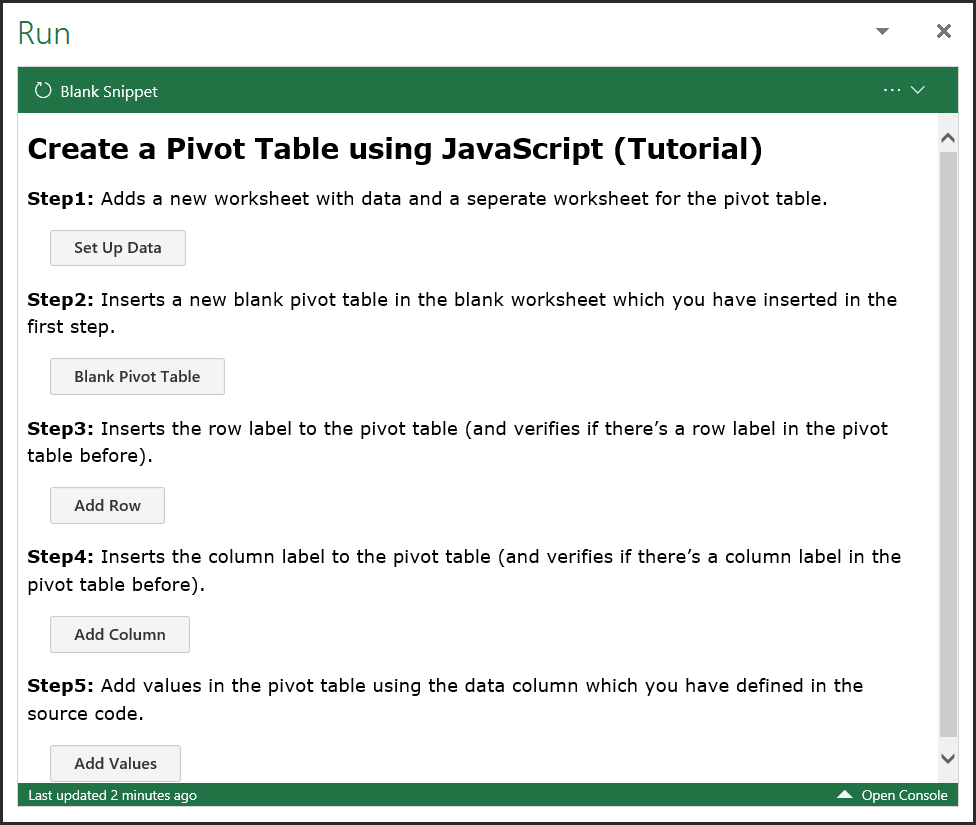
Because you have built your code in five parts, you will have five different buttons that execute those codes and create a PivotTable.
You just need to click on the button to execute each step.
Isn’t it COOL?
Make sure to share this post with your friends, I am sure they will appreciate it.
Quick Thing: Apart from learning about and using JavaScript in Excel, there's one more thing which I'm curious to learn these days, and that's Power Query's M language. Don't forget to check out M is for (Data) Monkey.
About the Author: Puneet Gogia

Puneet is the Co-Founder at ExcelChamps and has been using Excel since his college days. He's helped thousands of people to understand the power of spreadsheets and learn Excel and VBA. You can find him online, tweeting about Excel, on a running track, or sometimes hiking up a mountain.
One thought on “Using Script Lab to Create a PivotTable with JavaScript”
Pingback: 7 Advanced Features in Microsoft Excel - The Weekly Trends