Removing the top five rows from a data set is easy in Power Query, but what do you do when the number of rows changes? There isn’t a built-in Remove Dynamic Number of Top Rows function. In this post we’ll look at how to set this up.
Illustration of the issue
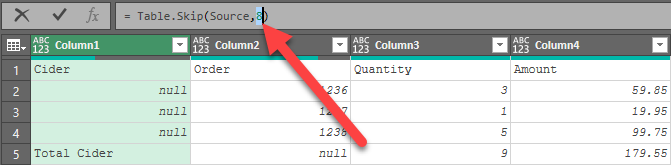
Assume you have the following report, and you’re only interested in the Cider sales:
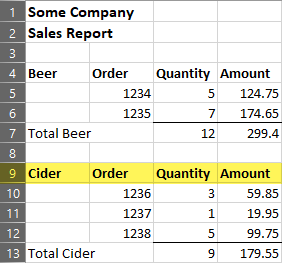
With Cider starting in row 9, we’d need to remove the top 8 rows. That’s fairly easy. You just need to:
- Go to Remove Rows -> Remove Top Rows -> 8
- Promote headers
- Do whatever else you need to do to the data
But then you get an updated version of the data set, and it looks like this:
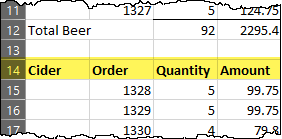
Uh oh. Best case, if you run the previously generated Power Query script, you’ll end up with the following result:
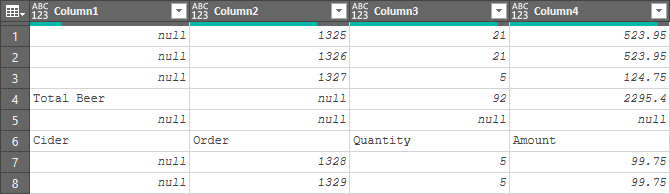
But more likely, if you promoted the clean header row from the original data set, you’ll get a step level error since the revised data set doesn’t yield a “Cider” column when row 1 (shown above) is promoted to header:

Regardless of which one of these scenarios appears worse to you, I think we can agree that neither one is desired. So how do we make this work on a dynamic basis?
Solution Architecture
The way I approach this issue is to split the job into 3 queries as follows:
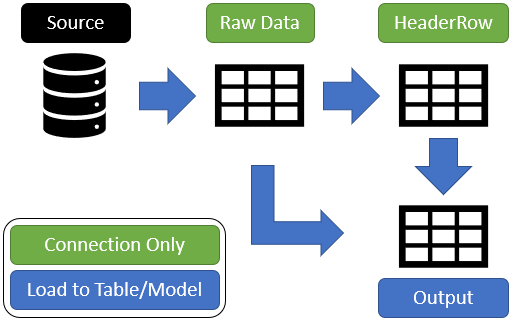
Let’s look at how this works in practice…
Query 1: Raw Data
The purpose of this query is quite simple:
- Connect to the Raw Data source
- Perform any preliminary cleanup
- Rename the query as “Raw Data” (add something descriptive if you have many data sources
- Set the query to load as a Connection Only query (disable the load in Power BI)
The key thing to note here is that we’re not doing any work to remove top rows beyond things that we know will ALWAYS occur. We may want to drop columns and other things to reduce our data set, we just don’t want to touch anything we can’t guarantee will be exactly the same when we get updated data.
In the case of the data sample I showed above, I’m just going to connect to the data set and load it as connection only. (While I could make an argument that the first 3 rows will always need to go, I will get rid of those when filtering to just the cider header anyway.)
Query 2: Generate the Dynamic Row Number
The next step is to generate the number that will indicates the dynamic number of top rows we are looking for. Despite the fact that the row which holds our data is changing, this is actually relatively easy once you know how:
- Right click the Raw Data query -> Reference
- Go to Add Column -> Add Index Column -> From 0
- Filter one of the columns to the data you are looking for
- Right click the [Index] Column -> Remove Other Columns
- Go to Home -> Keep Rows -> Keep Top Rows -> 1
- Right click the value in the cell -> Drill Down
- Rename the query as “HeaderRows”
- Set the query to load as a Connection Only query (disable the load in Power BI)
You now have a query that will dynamically pick up the number of rows to be removed from the top of the data set before it encounters the text you are looking for.

Step 3: Remove Dynamic Number of Top Rows
So now comes the magical part:
- Right click the Raw Data query -> Reference
- Go to Home -> Remove Rows -> Remove Top Rows
- Type in the current number of rows to remove (for this example, we’ll assume it is 8 rows)
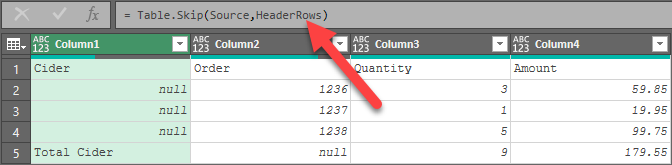
The formula bar will now be showing the formula =Table.Skip(Source, x ) where x is the value you typed in:
- Replace the value with “HeaderRows”
CAUTION! Power Query is case sensitive. You must spell and case HeaderRows EXACTLY as you did previously. And if you separated those two words with a space, you need to escape it with hash marks and quotes: #"Header Rows"
If you’ve replaced everything correctly, you should see that everything still works:
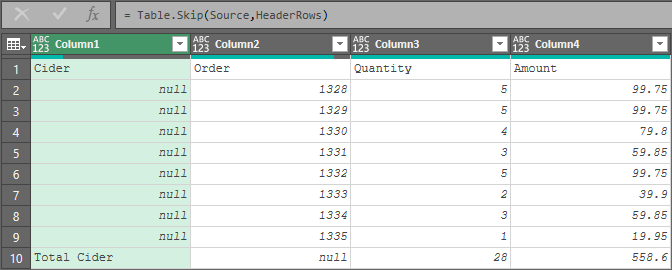
Does it Work?
Here’s what we see when we point RawData to the second data set I showed earlier:
The sample file for this example can be downloaded here.
9 thoughts on “Remove Dynamic Number of Top Rows”
Hi Ken. Why not just use the following M?
=Table.Skip(Source, each [Column1] “Cider”)
This technique could also apply to Table.FirstN too.
My bad. The correct formula is the following
=Table.Skip(Source, each [Column1] “Cider”)
I don’t know why but the “not equal” sign just disappeared after I submitted.
Marshal, thanks a lot for sharing!
@marshal
Great tip! Thanks!
This is great, Ken! Thanks for sharing.
Any chance of adding this to the Power Query Recipes? That's where I went looking for this, but didn't find it there.
Possibly Nick. I'll add it to my list. 🙂
This is great and I also went to my recipe cards first, so my vote is this be added, too!
I had a slightly different situation, where I needed to find which row had the headers, but couldn't rely on a filter based on a certain column. For instance, I need to search for "Transaction Type", but it could be in any column depending on how the data was exported. There would always be a Transaction Type, I just wouldn't know which column. I got around this by adding a custom column that first converts the record to a list and then searches the list and returns TRUE or FALSE.
= Table.AddColumn(#"Added Index", "IsHeader", each List.Contains(Record.ToList(_),"Transaction Type"))
Then I filtered for TRUE on my IsHeader column and continued on from there. Hope this helps someone else.