I was presented with an interesting problem last week: how to create running totals in Power Query. There doesn’t appear to be a built in method to do this, so I thought it would make an interesting use case study.
Background
Let’s take a look at the following table, which can be found in the sample file found here (if you’d like to follow along.)

Now, we could certainly use a Pivot Table to create running totals, but consider the scenario where we want to preserve the original list. Pivot Tables aggregate data and apply running totals to the aggregation, so that might not suit our needs. (In the case of the table above, it would aggregate both records for 1/2/2015 into a single line.)
We could also set up a formula on our table that summed the row above plus the row to the left, for example. Of course that means you MUST land it in the worksheet, which may not be ideal either.
This solution is entirely possible to solve with Power Query, but with no one click feature in the user interface, how do we pull it off?
Creating the Staging Query
The first thing I did is create a query to pull in my data source and land it in a “Staging” table inside Power Query, as per this post. To do that I:
- Selected a cell in the table
- Went to Power Query –> From Table
- Selected the Date column –> Transform –> Data Type –> Date
- Went to Add Column –> Add Index Column –> From 0
At this point the query looks like this:

Next I finalized the staging query. I:
- Changed the table name to “Staging-Sales”
- Went to File –> Close and Load to… –> Only Create Connection
- Right clicked the query in the Workbook Queries pane –> Move to Group –> Staging
Building a Running Total Function - Groundwork
With the staging query in place, it was time to tackle the real problem; the method to create running totals in Power Query. That work requires a bit of down and dirty M work, and here’s how I approached this to build up my end solution:
- Right click the “Sales” staging query and choose Edit
This will land you back in the Power Query editor. On the left side of the window, expand the vertical “Queries” window by click on the little arrow until you see this:

With this window expanded, we can begin creating our function:
- Right click “Sales” –> Reference
- Right click “Sales (2)” –> Move to Group –> Create Group –> “Functions”
- Change the name from “Sales (2)” to “fnRunningTotal”
Things should now look as follows:

Perfect. We now have the query set up the way we need to take our next steps. Right now it’s just pointing to our Sales query and pulling the data in, but that will change.
From a logic point of view, here’s what I want to happen:
- I want to take a row from the Sales table
- I want to send a copy of the table to my function
- I want my function to remove all rows where the index is higher than the submitted row
- I want to sum the remaining values
- I want to return that total back to the calling row
So let’s start working through that process… we’ll come back to steps 1 and 2 in a bit… let’s pretend those have already happened, and focus on the rest.
- Select the Sale and Index columns –> Home –> Remove Columns –> Remove Other Columns
- Click the Index column filter –> Number Filters –> Less than or equal to
- We’ll pick an arbitrary starting point like 2 for right now

- Rename the “Sale” column to “Temp”

Now we’re going to take the final step with this data before we convert it into a function. We are going to group it, so go to:
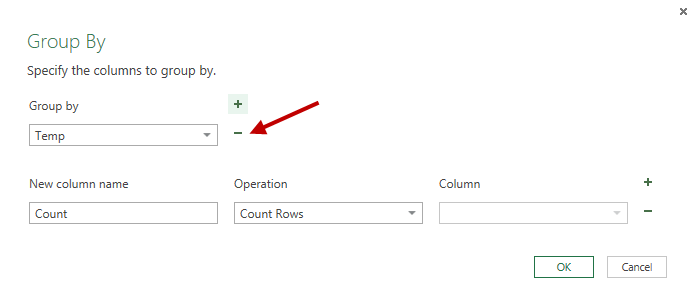
- Transform –> Group By
Now, we need to tweak the default a bit to get it right. The very first thing we need to do is remove the “Group By” level that groups by Temp, as we want to group all remaining rows together. To do that, you click the – button beside Temp:
Next we need to set our data correctly. We are going to set it to:
- New column name: RunningTotal
- Operation: Sum
- Column: Temp
And at this point, our output should look like this:

Building a Running Total Function – Finalization
With this in place, we now need to turn this into a real function. And to do that, we need to step into the M code itself. So go to View –> Advanced Editor to do that.
Now, at the very top of the M code (before the let line), we are going to insert the following code:
(tbl as table, sumcolumn as text, rowindex as number) =>
This code will allow us to pass in the table, which column we want to sum, and which row we are working with when we call the function.
Next we need to plumb these variable into our code. To do that we will:
- Remove the “Source = Sales,” line of the M query
- Replace every instance of Source in query (there is only one) with the name of our table: tbl

- Replace every instance of “Sale” in the query with the name of the variable which holds our column name; sumcolumn.

Note that we do not need to wrap sumcolumn in quotes, as Power Query knows that it is text based on the parameter definition at the head of the function.
- In the #”Filtered Rows” step, replace the hard coded 2 with the name of the variable which holds our index number; rowindex.

- Place a comma at the end of the #”Grouped Rows” line (to make way for the next step)
- Replace the last two rows with the following to return the single value back to the caller:
RunningTotal = Record.Field(#"Grouped Rows"{0},"RunningTotal")
in
RunningTotal
When complete the function looks as follows:

And now click Done. At this point, your query should flip to appear as a function. This is evident in three ways:
- The icon in the left pane changes to an fx logo
- The table disappears and is replaced with the function parameters and an invoke box
- The Applied Steps collapse to a single line (I wish this didn’t happen)
Commit it by choosing File –> Close and Load
Create Running Totals in Power Query
So now… did it work? Let’s find out.
- Right click the Sales query in the Workbook Queries pane and choose Edit
- Expand the queries pane on the left
- Right click Sales –> Reference
- Right click Sales (2) –> Move to Group –> Other Queries
- Rename Sales (2) to “Landing”
- Go to Add Column –> Add Custom Column
- Call the column “Running Total”
And now we need to enter our formula. The actual formula itself will be:
=fnRunningTotal(Source,"Sale",[Index])
Here’s how it breaks down:
- fnRunningTotal is the name of the function
- Source is the name of the previous step in the Applied Steps section. This allows us to pass the entire table that is generated up to that point
- “Sale” is the name of the column we want to summarize. The quotes here indicated that we are going after the column’s name, not the data in that column’s row.
- [Index] is surrounded in square brackets as we want to pass the value for that row of the index column. That is the row that is then used to filter down the data.
And the result, if you followed along exactly, is this:

So at this point, we can remove the Index column and call it done. You’ll find a complete version here if you’d like to review it.
Final Thoughts
This looks like a very long and cumbersome route, but overall it’s actually not that complicated once you understand it. The key points that I want to highlight here are:
- We started with a simple Staging query
- We used that as a reference and stepped through the process of filtering down the data for one record
- We converted the new query to a function by:
- Defining a line at the beginning to receive 3 variables
- Integrated the variables into the code in place of hard values
- Added an ending to feed back a single value
- We used our function
The first line of the query is essentially just () => and any variables we need go between the brackets. And while I declared there types, you don’t actually even have to do that.
The last line of code before the in is the trickiest part. And here’s a secret… I just come back to a blog post and copy this part:
RunningTotal = Record.Field(#"Grouped Rows"{0},"RunningTotal")
The secret is understanding that the #"Grouped Rows" portion is just the name of the previous step in the M code, and the final “RunningTotal” is the name of the column you want to return. That lets me retrofit it pretty easily into any other function.
So… would it be faster to just flip it into a pivot and add running totals there? Absolutely. Would it be faster to just land the data in a table and create a running total formula down the table? Absolutely. But if those aren’t options, then Power Query may be a viable solution for you. 🙂
36 thoughts on “Create Running Totals in Power Query”
Nice workaround, Ken!
Thanks for sharing!
Ken, great post! Great idea to use a function to calculate a running total.
You inspired me to play around with this a bit, and a shorter possible version of fnRunningTotal is:
(tbl as table, sumcolumn as text, rowindex as number) =>
let
#"Filtered Rows" = Table.SelectRows(tbl, each [Index] <= rowindex), RunningTotal = List.Sum(Table.Column(#"Filtered Rows",sumcolumn)) in RunningTotal
Also do you think it would be useful to have a version where indexcolumn is also a parameter of the function? That would allow Date or another natural index to be used. I added back some of your original column removals and renamed columns to ensure no naming conflicts:
(tbl as table, sumcolumn as text, indexcolumn as text, rowindex) =>
let
#"Removed Other Columns" = Table.SelectColumns(tbl,{sumcolumn, indexcolumn}),
#"Renamed Columns" = Table.RenameColumns(#"Removed Other Columns",{{sumcolumn, "SumColumn"},{indexcolumn,"IndexColumn"}}),
#"Filtered Rows" = Table.SelectRows(#"Renamed Columns", each [IndexColumn] <= rowindex),
RunningTotal = List.Sum(Table.Column(#"Filtered Rows","SumColumn"))
in
RunningTotal
Ozeroth,
Thanks for the comments, and love the shortened version using List.Sum. Of course it's hard to record the guts for that, but shows how much more efficient we can make things when we learn to code in M. 🙂
I also like the idea on abstracting the index column to use natural indexes. I may have to play around with that one.
And here is a "one query" version without function. 🙂
let
Source = Excel.CurrentWorkbook(){[Name="Sales"]}[Content],
ChType = Table.TransformColumnTypes(Source,{{"Date", type date}}),
AddIndex = Table.AddIndexColumn(ChType, "Indeks", 0, 1),
ListOfSale = ChType[Sale],
RunningTotal = Table.AddColumn(AddIndex, "Running Total", each List.Sum(List.Range(ListOfSale,0,[Indeks]+1))),
RemoveCol = Table.RemoveColumns(RunningTotal,{"Indeks"})
in
RemoveCol
Regards
Nice Bill. 🙂
Hi Ken 🙂
I rethink "running total" case.... here is the most efficient way I know.
It is much much faster than other...try for 10 thousand rows.
let
Source = Excel.CurrentWorkbook(){[Name="Sales"]}[Content],
ChType = Table.TransformColumnTypes(Source,{{"Date", type date}}),
AddIndex = Table.AddIndexColumn(ChType, "Indeks", 1, 1),
List = List.Buffer(AddIndex[Sale]),
RunningTotal = Table.AddColumn(AddIndex, "Running Total", each List.Sum(List.FirstN(List,[Indeks]))),
RemCol = Table.RemoveColumns(RunningTotal,{"Indeks"})
in
RemCol
Regards.
Pretty cool stuff here 🙂
When it comes to long tables, the following approach actually speeds it up considerably (recursion, but need to read every row only once:
Source = Excel.CurrentWorkbook(){[Name="Sales"]}[Content],
ChangedType = Table.Buffer(Table.TransformColumnTypes(Source,{{"Date", type date}})),
Iterate = List.Buffer(List.Generate(
()=>[Counter=0, Value_=ChangedType[Sale]{0}],
each [Counter]<=Table.RowCount(ChangedType),
each [Counter=[Counter]+1,
Value_=[Value_]+ChangedType[Sale]{[Counter]+1}],
each [Value_])),
Table = Table.FromColumns({ChangedType[Date], ChangedType[Sale], Iterate}),
Rename = Table.RenameColumns(Table,{{"Column1", "Date"}, {"Column2", "Sale"}, {"Column3", "CumSale"}}),
RemError = Table.RemoveRowsWithErrors(Rename, {"CumSale"})
in
RemError
for Bill Szysz - very very cool & unbelievably elegant -- I've been looking for a ‘non-functional’ way to do this aggregation for a month. Many thanks
Hi Imke Feldmann
You're too advanced for me!!! It's hard to understand the logic behind. It's not easy to compare the performance of your solution with Bill's.
A newbie here and I appreciate the code provided. Can I ask how one could iterate over a change in value stored in another column? Taking the table provided in the post I added a "Prod" column and added some more values. What I'm trying to get is to have the a running total for each product group as show below:
Date Prod Sale RunningTotal
1/1/2015 A 497 497
1/3/2015 A 436 933
1/4/2015 A 521 1454
1/5/2015 A 412 1866
1/6/2015 A 245 2111
1/7/2015 A 128 2239
1/8/2015 A 305 2544
1/9/2015 A 15 2559
1/2/2015 B 451 451
1/3/2015 B 652 1103
1/4/2015 B 499 1602
1/5/2015 B 268 1870
1/6/2015 B 145 2015
1/7/2015 B 287 2302
1/8/2015 B 422 2724
1/9/2015 B 545 3269
1/2/2015 C 632 632
1/3/2015 C 258 890
1/4/2015 C 365 1255
1/5/2015 C 280 1535
1/6/2015 C 271 1806
1/7/2015 C 368 2174
1/8/2015 C 280 2454
1/9/2015 C 285 2739
Thanks for any help in advanced.
Hi Jeff,
I think I might need to do up another blog post on this one to explain how I modified it to do what you're looking for. Stay tuned!
Thumbs up for Imke:)
I am working on import of Timephased data from Microsoft Project Online to generate a burndown chart. This might cause import of hugh amount of data. Tried both suggested solutions, from Bill and Imke) and Imke solution is far more efficient:)
BTW: The name of table and field are the norwegian translation of MS Project tables
let
Source = AktivitetTidsinndeltDatasettListe,
#"Merged Queries1" = Table.NestedJoin(Source,{"AktivitetID"},Aktiviteter,{"AktivitetID"},"NewColumn.1",JoinKind.Inner),
TabellBuffer = Table.Buffer ( Table.SelectColumns(#"Merged Queries1",{"TidspunktPerDag", "AktivitetFaktiskArbeid", "Aktivitetsarbeid"})),
UtførtArbeidIterator = List.Buffer(List.Generate(
()=>[Counter=0, Value_=TabellBuffer[AktivitetFaktiskArbeid]{0}],
each [Counter][Counter=0, Value_=TabellBuffer[Aktivitetsarbeid]{0}],
each [Counter]<=Table.RowCount(TabellBuffer),
each [Counter=[Counter]+1,
Value_=[Value_]+ TabellBuffer[Aktivitetsarbeid]{[Counter]+1}],
each [Value_])),
#"NyTabell" = Table.FromColumns({TabellBuffer[TidspunktPerDag], PlanlagtArbeidIterator, UtførtArbeidIterator}),
#"Renamed Columns" = Table.RenameColumns(NyTabell,{{"Column1", "Dato"}, {"Column2", "Planlagt Arbeid"}, {"Column3", "Utført Arbeid"}})
in
#"Renamed Columns"
Jeff - here's some code that delivers a running total value summed over the A,B,C subcategories then a running total over the total column.
let
Source = Excel.CurrentWorkbook(){[Name="Table6"]}[Content],
ChangedType = Table.TransformColumnTypes(Source,{{"Date", type datetime}, {"Letter", type text}, {"Item", Int64.Type}}),
AddedIndex = Table.AddIndexColumn(ChangedType, "Index", 1, 1),
GroupedRows = Table.Group(AddedIndex, {"Letter"}, {{"Count", each _, type table}}),
DuplicatedColumn = Table.DuplicateColumn(GroupedRows, "Count", "Count - Copy"),
ExpandedCount = Table.ExpandTableColumn(DuplicatedColumn, "Count", {"Date", "Index", "Item"}, {"Date", "Index", "Item"}),
ExpandedCountCopy = Table.ExpandTableColumn(ExpandedCount, "Count - Copy", {"Index", "Item"}, {"Index.1", "Item.1"}),
AddedCustom = Table.AddColumn(ExpandedCountCopy, "Custom", each [Index] >=[Index.1]),
FilteredRows = Table.SelectRows(AddedCustom, each ([Custom] = true)),
GroupedRows1 = Table.Group(FilteredRows, {"Date", "Letter", "Item", "Index"}, {{"Sub", each List.Sum([Item.1]), type number}}),
ChangedType2 = Table.TransformColumnTypes(GroupedRows1,{{"Date", type date}}),
AddedCustom1 = Table.AddColumn(ChangedType2, "RngTtl", each List.Sum(List.FirstN(ChangedType2[Item],[Index])))
in
AddedCustom1
**********************************
thanks - DrewBBC
Ken, my only concern about this approach is that it's too slow to use on large data sets (e.g., +250k rows). Do you know of a faster approach?
Hey Mark,
I'd take a look at Imke's approach which was posted a few comments up. That might help.
Ken, I need cumes by a grouping of 1 ore more columns. Your approach was easy enough to modify for my purposes. Imke's seems to be a bit more difficult to repurpose.
Hi Ken,
hope this is not way too off topic - if it is, sorry for disturbing and do not hesitate to delete it.
Your blog is the closest hit for my issue I've found.
With my 3-days PQ knowledge and experience I've tried to bend your approach to add the (value and the) reference to a local minimum, but I failed.
I have a dataset with offers, columns "row/item name", "supplier name" , "Price".
Want to add two columns, one with the best bid for the row/item and one with the name of the supplier who made the best bid.
I managed to add the value by means of a helper aggregating query, the name I was trying to add by means of a function that used your logic:
(tbl as table, rowname as number)=>
let
#"Removed Other Columns" = Table.SelectColumns(tbl,{"row name", "supplier name", "Price aggregated", "NewColumn.Best Bid"}),
#"Added Custom" = Table.AddColumn(#"Removed Other Columns", "BestBid", each if[Price aggregated]=[NewColumn.Best Bid] then true else false),
#"Changed Type" = Table.TransformColumnTypes(#"Added Custom",{{"BestBid", type logical}}),
#"Filtered Rows" = Table.SelectRows(#"Changed Type", each ([row name] = rowname) and ([BestBid] = true) and ([supplier name] "base price")),
#"Removed Other Columns1" = Table.SelectColumns(#"Filtered Rows",{"supplier name"}),
BestBidCarrier = Record.Field(#"Removed Other Columns1",{0},"BestBidCarrier")
in
BestBidCarrier
I fail to use the function in my "landing" file.
Calling it with fnBestBidCarrier(Source,[row name]))
getting an error message
An error occurred in the ‘’ query. Expression.Error: 3 arguments were passed to a function which expects 2.
Details:
Pattern=
Arguments=List
Any hints greatly appreciated.
Thanks to Imke Feldmann your code works fine I just add some adjustments to improve performance.
A 8000 registers takes only 6 seg in the original takes 2 min.
let
Source = Table.Buffer(Excel.CurrentWorkbook(){[Name="Sales"]}[Content]),
ChType = Table.Buffer(Table.TransformColumnTypes(Source,{{"Date", type date}})),
AddIndex = Table.Buffer(Table.AddIndexColumn(ChType, "Indeks", 0, 1)),
ListOfSale = List.Buffer(ChType[Sale]),
RunningTotal = Table.Buffer(Table.AddColumn(AddIndex, "Running Total", each List.Sum(List.Range(ListOfSale,0,[Indeks]+1)))),
RemoveCol = Table.RemoveColumns(RunningTotal,{"Indeks"})
in
RemoveCol
Hi Ken,
nearly all Versions of running Totals use Grouped Data around Dates.
I'm looking for a solution to get the running total like this Excel Solution in a calculated column with the use of a sorted Index. Thanks in advance.
Index Saldo Running Total
1 0 0
2 -87,5 -87,5
3 -225 -312,5
4 -237,5 -550
5 350 -200
6 -75 -275
7 0 -275
8 12,5 -262,5
9 50 -212,5
10 12,5 -200
11 -12,5 -212,5
12 50 -162,5
13 37,5 -125
14 -150 -275
15 450 175
16 -150 25
Sure Peter,
let
Source = Excel.CurrentWorkbook(){[Name="Table1"]}[Content],
#"Changed Type" = Table.TransformColumnTypes(Source,{{"Saldo", type number}, {"Running Total", type number}}),
#"Added Custom" = Table.AddColumn(#"Changed Type", "Custom", each List.Sum(List.FirstN(#"Changed Type"[Saldo],[Index])))
in
#"Added Custom"
Hope that helps!
Hey Jozef,
Sorry for the late reply on this. This article should help answer your question: https://excelguru.ca/2016/04/28/pass-parameters-to-sql-queries/
Question regrding the code used by Imke, thomas ans Alcides in their comments:
you, Guys are using "buffer" functions like:
- Table.Buffer
- List.Buffer
while other people use the simple functions.
I wonder if someone could explain the benefit of using the "buffer" functions. Is there speed improvment, or something else ?
The msdn does not really help. It says:
List.Buffer: Buffers the list in memory. The result of this call is a stable list, which means it will have a determinimic count, and order of item.
Thank you, Anthony
I Anthony,
I just use to speedup things.
I tested Imke's use of List.Generate and compared it to the alternatives proposed above, such as the idea of calling "List.Sum(List.Range(..." for each record. I tested them on a list of 100,000 values. List.Generate completed in 3 seconds, while the others, which, um, don't scale all that well, took nearly 6 minutes.
So let me amplify Imke's comment. Here's a refactored and (heavily) annotated version of Imke's code, with a single correction. Turns out that it is not much more complicated conceptually than a Do... While loop in C# with two variables plus a condition for continuing the loop.
You could call this one fnGetRunningTotalList
***
(values as list) as list =>
let
/*
Note: List.Generate, which follows, generates a list of values from
four functions that you define and pass in as parameters. These
functions are:
(a) generate the initial value (and define/initialize/assign
the variables that will be referred to in the other three functions);
(b) test against a condition that evaluates as true or false to
determine whether to proceed to the next iteration, defined with
function (c) (described next);
(c) generate the next value. This is the code that executes
for each iteration processing each value in the list; and,
(d) selector to indicate which variable is returned, which is
required where there is more than one variable defined in
functions (a) and (c).
The interesting part of this function is part (c). Note that the
function "remembers" the values of the accumulatingValue and the row
index, "i", from the previous iteration and literally builds upon
them while storing the accumulatingValue at each iteration as it
builds the result list, "ResultTotalList".
(In C# and VB, these would be called "static variables".)
Note that (d) is necessary in this case because we need to tell
List.Generate which of the two variables (accumulatingValue and i) to
yield to the function at each iteration, as it accumulates the full
list of values.
*/
RunningTotalList
= List.Buffer(
List.Generate(
()=>
[
accumulatingValue = values{0},
i = 0
],
each [i] < List.Count(values),
each
[
accumulatingValue
= [accumulatingValue]
+ values{[i] + 1},
i = [i] + 1
],
each [accumulatingValue]
)
)
in
RunningTotalList
***
You can call this function with code something like the following, which you might call, RunningTotalCallingCode:
***
let
Source = Excel.CurrentWorkbook(){[Name="SourceTable"]}[Content],
BufferedValuesList = List.Buffer(Source[Value]),
ResultTable = Table.FromColumns(
{
Source[Value],
fnGetRunningTotalList(BufferedValuesList)
},
{
"Value",
"Running Total"
}
)
in
ResultTable
***
To generate the 100,000 rows of data I created a table with a single column called "Value" using the following Excel formula:
=randbetween(10000,100000)/100
I copied the initial set of data to values and then refreshed as I did the tests.
The one small error corrected in Imke's code was the "<=", which should be a "<" (because one side of the inequality is a record count and the other one refers to a zero-based index). This eliminates the error generated at the end of the list, and, in the example, the need for Imke's line with Table.RemoveRowsWithErrors.
I want to thank the author of the original post and also Imke and the other posters for taking up a topic that is really crucial.
Hi All,
Here's a version to consider...
Call this function YTD
(toPeriod)=>
let
Source = Sold,
Tally = Source{toPeriod-1},
Total = if toPeriod=1 then Tally[Sales] else Tally[Sales] + @YTD(toPeriod-1)
in
Total
Assumes you've got a Period number starting at 1 in your Source.
Just add a custom column to your calling table invoking YTD([Period])
Hi Ken,
using your sample data and adding an index column, you solve this with one function and a new query.
The new function is this... which I call "YTD()":
___________________________________
(Index)=>
let
Source = Sales{Index},
Total = if Index = 0 then Source[Sale] else Source[Sale] + @YTD(Index-1)
in
Total
___________________________________
and the new query is this... which I call "Sales Growth":
___________________________________
let
Source = Sales,
#"Added Custom" = Table.AddColumn(Source, "Running Total", each YTD([Index]))
in
#"Added Custom"
____________________________________
Okay all done. It will produce this result:
Date Sale Index Running Total
1/01/2015 0:00 497 0 497
2/01/2015 0:00 451 1 948
2/01/2015 0:00 632 2 1580
3/01/2015 0:00 436 3 2016
4/01/2015 0:00 499 4 2515
5/01/2015 0:00 280 5 2795
6/01/2015 0:00 271 6 3066
7/01/2015 0:00 368 7 3434
8/01/2015 0:00 280 8 3714
9/01/2015 0:00 285 9 3999
10/01/2015 0:00 461 10 4460
How it works is via recursion
Each the function YTD(9) will evaluate the sum of 285 plus 3714.
It gets 3714 from YTD(8) which is evaluated as sum 280 plus 3434.
It gets 3434 from YTD(7) which is evaluated as sum 368 plus 3066 and so on
....until it reaches YTD(0) which is a terminal detected by the "If index=0" then 497
The way that M handles recursion is that a function can call itself from inside that same function provided that it uses the @ symbol when calling itself. so @YTD(Index-1) is used each time that Index is above the value 0.
Here is a link to the above solution in a workbook.
https://1drv.ms/x/s!Agc3uI9a_2aOiUhhXmb5HS7G528j
Hey David,
That's very cool. I am curious about performance though... relatively quick, or does it have the same performance implications of standard queries farmed out to functions?
Hi David,
I was playing around with recursive functions to try and solve this. But before I went to far as I am dealing with millions of rows was wondering whether a recursive function might blow up the stack.
Do you know if M optimises recursive functions using tail end recursion or anything like that.
Hi Ben,
I've found that reaching to functions which are executed for each line of a query can be a very slow process.
Hi Ken!
Thanks for sharing this great tutorial.
Although, I got a question,
when i make every step you wrote, at the end, I got an error message:
"Expression.Error: We cannot convert the value 43 to type Text."
My "sum" column is decimal type.
I also tried to change the text to number in
(tbl as table, sumcolumn as number, rowindex as number) =>
without luck.
Could you pleaase help find the issu?
Many thanks,
tamas
Hi Tamas,
I think the best thing to do here would be to post in our forum at http://www.excelguru.ca/forums. Upload your sample, and someone can look at it and help debug what's gone wrong.
Hi Imke,
Loved your solution. How would you adapt it to a grouped cumulative sum?
Thanks
Thanks to David Chennells for explaining Imke's solution in enough detail that I was able to use List.Generate in a query. And, of course, thanks to Ken for providing such a valuable resource!
The only thing I regret is that I found out about this now and not a couple of years ago, when I needed this strategy that you explained to create a solution for a client that involved cumulative sums. (Finally, I downloaded everything to EXCEL and used SUMIFS and logic functions to solve my challenge, no way).
Thank you very much for sharing your knowledge in such a selfless way. ¡G'd bless you!