We all know how good Power Query is for cleaning, shaping and analyzing numerical data. But this powerful tool opens doors for analysts that had been closed for long time, such as for analyzing text. In this article, I will give you some ideas how Power Query can be used for analyzing text that is unstructured. This is a new area for me as well so I’ll be grateful for any comments, thoughts, ideas and shared experience that will help to elaborate further on the methodology.
Our scenario
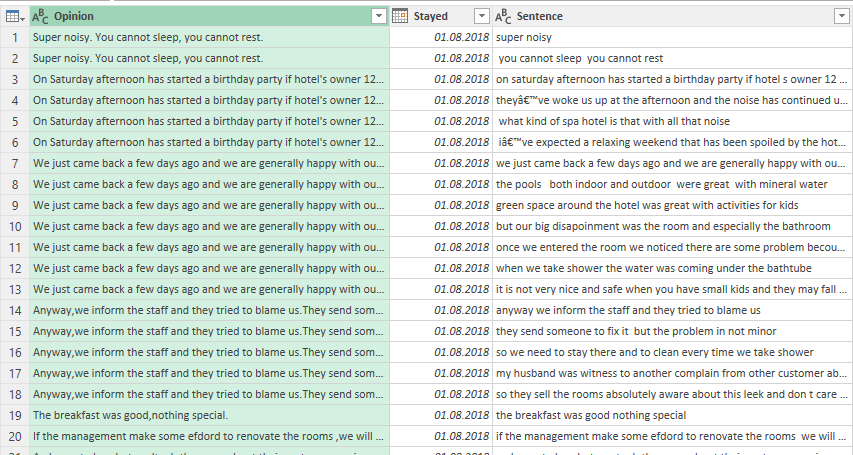
First, let’s put things in a context with simple but realistic example. Assume you are the newly appointed Marketing Manager of a 4-star SPA hotel. You want to analyze reviews about the hotel in sites like booking.com and tripadvisor.com to understand the major service issues. Thanks to Power Query, you will be able to extract, clean and shape data from those sites to receive a nice table like this:
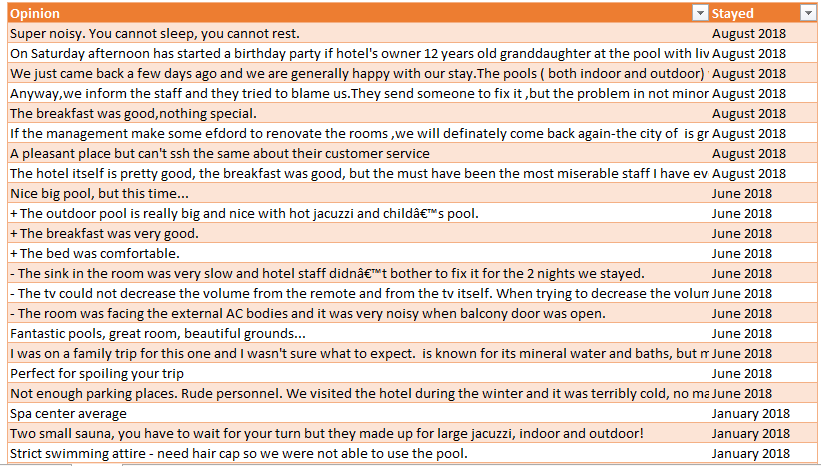
* Table contains ~300 real opinions for several Bulgarian SPA hotels in Hissarya, Velingrad, Sandanski and Bansko. Source: booking.com and tripadvisor.com
But how can you get some insights from this data? Obviously you will spend lots of time to read all reviews. Even if you do that, you need to summarize the information somehow. So let’s play a little within Power Query and see how it can help us analyze text.
Preparing data for analysis
First, we load the table in Power Query (From Table) and clean it of punctuation symbols like commas, semicolons, dashes, brackets, etc., as well as replace capital letters with lower cased one. Why do that last one? Because we want to count the most frequently used words and for Power Query ‘hotel’, ‘hotel,’, ‘Hotel’ are different words.
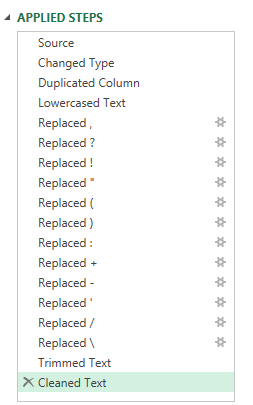
The cleaning can easily be done with tools like Replace Values, Trim, and Lowercase. I believe they are well-known to average user of Power Query so will I skip detailed operations. Instead, here some lessons learnt from practice:
- First, duplicate the Opinions column so you can have original text.
- Then, replace all punctuation symbols with a space.
- Later we will use a period a separator to split opinions into sentences. And since a sentence can finish with exclamation mark or a question mark it is useful to replace ‘!’ and ‘?’ with ‘.’
- Since this is a hotel, clients may use the symbol ‘*’ in their opinions (i.e. ‘nice 4* hotel’ or ‘definitely not a 4* hotel’). So don’t replace this symbol.
Above points are nice examples that when analyzing text or other data you need to do it in a context and should explore it first, but that is another story.
Here are the steps applied so far. As a final touch the text has been trimmed and cleaned.
Separating each comment
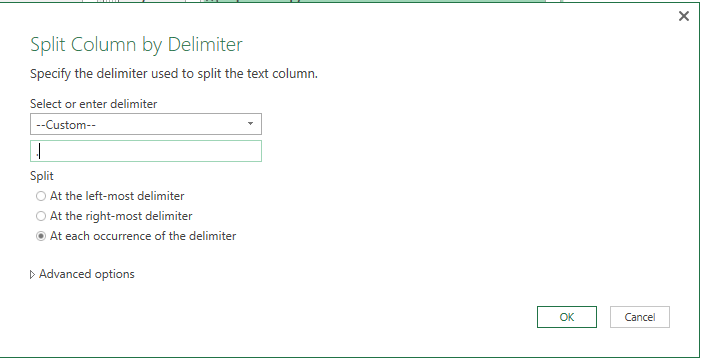
Our next step is to split the column using a period ('.') as a delimiter, and doing so at each occurrence of the delimiter.
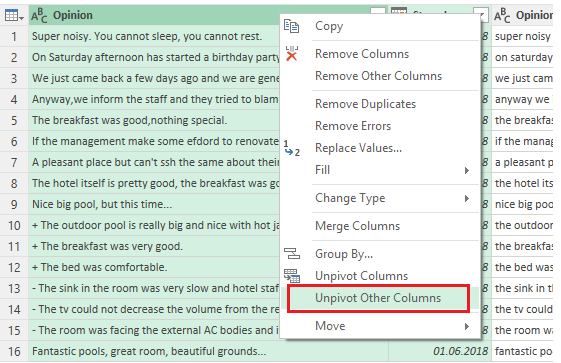
Power Query creates a number of new columns, each one containing a sentence. I bet you are guessing what will follow. That’s right – select the original two columns and choose Unpivot Other Columns.
After removing the Attribute column and filtering out rows that are blank, our table has a column for the original comments (Opinion) and a column for each sentence contained in the original comments (Sentence). Please be patient here, and you will understand why this is important.
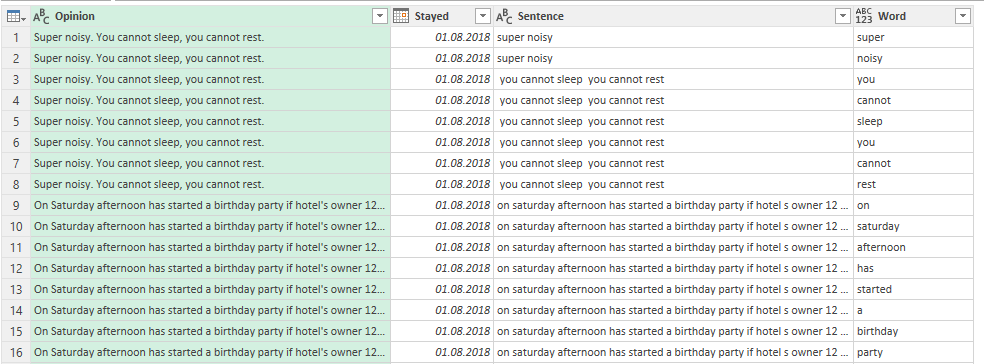
Let’s now duplicate the Sentence columns and repeat the above actions: split each sentence into its individual words, then unpivot. Below is the table after removing the Attribute column and filtering out blank rows:
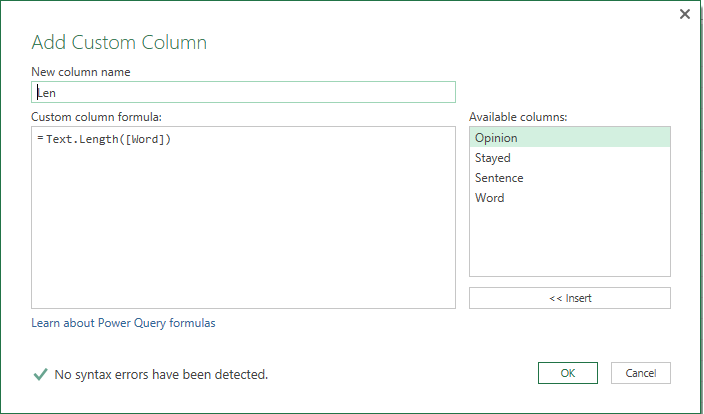
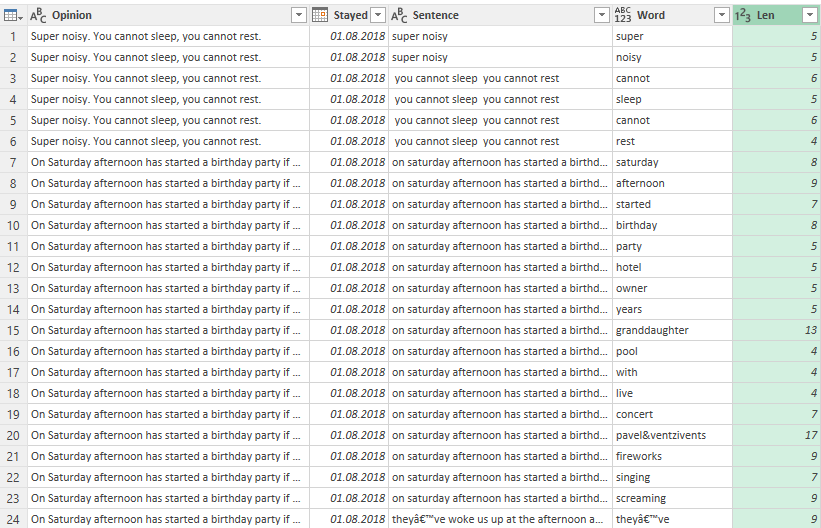
As a next step I will add custom column with a simple formula that calculates the length of each word. We can use it to remove common words that bring no value to our analysis – ‘a’, ‘the’, ‘is’, ‘or’, ‘but’ etc.
Finally, filter to exclude words that are 1, 2 or 3 letters long. We will use the resulting table as the basis for analyzing text.
Finding Lookup words
As a first step in analyzing text, let’s Duplicate the query (you may use Reference as well).
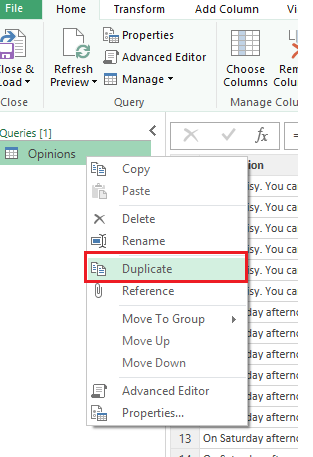
In the new Query, simply use the Group By function on the Words column to count the rows.
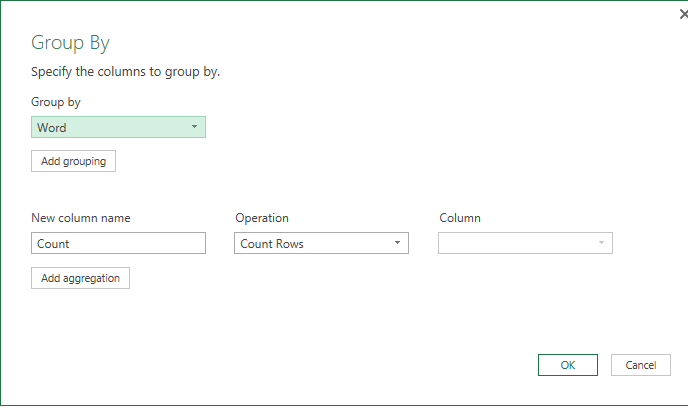
Thus, we will have a list with all words (above 3 letters long) and how many times they have been used. For convenience, we can sort this and then load it into Excel.
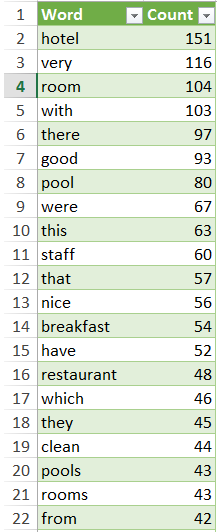
Let’s take a look at the list. Obviously it contains words like ‘with’, ‘this’, ‘have’ that we need to ignore because they could be used in many different situations. On the other hand we see ‘good’ and ‘nice’ in the top 20. Those words are highly subjective – what is good for me might not be good for you. Besides, we don’t know whether the reviewer said ‘good food and nice service’ or ‘the food was not good and service far from nice’. So let’s skip them for now.
Apart from the above, we see that customers mention most often words like ‘room’, ‘pool’, staff’, ‘food’. These are our words of interest (I call them ‘Lookup words’). We may now filter all sentences that contain these words, allowing us to read much less information compared to original list of opinions.
Honestly speaking, if you have enough experience or even some common sense, you can skip this step. I mean it is more than expected that ‘room’, ‘staff’ and ‘pool’ are most often mentioned in reviews for a SPA hotel. However, identifying lookup words might be needed for cases like analyzing text of more open-ended questions.
Filtering Lookup words
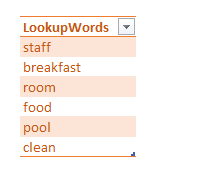
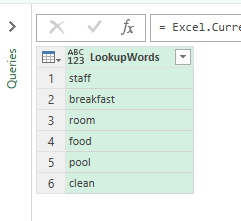
So far we have identified our words of interest and listed them in a table:
So how do we filter all sentences containing these lookup words? We can make it dynamic by creating a custom function. The process is similar to one used to load data from multiple internet pages, as described in M is for (Data) Monkey.
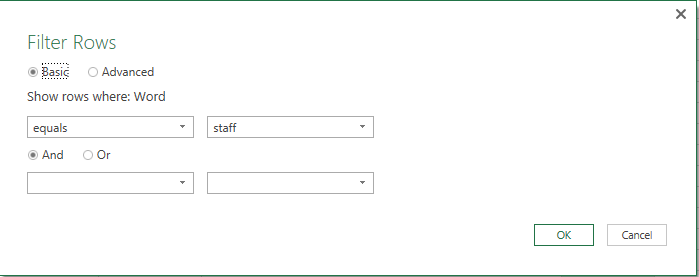
First, we create a query to Filter Rows of the Word column that contain one of our lookup words, ‘staff’ for example.
Then we go to Home > Advance Editor and change the M code a bit as shown below:
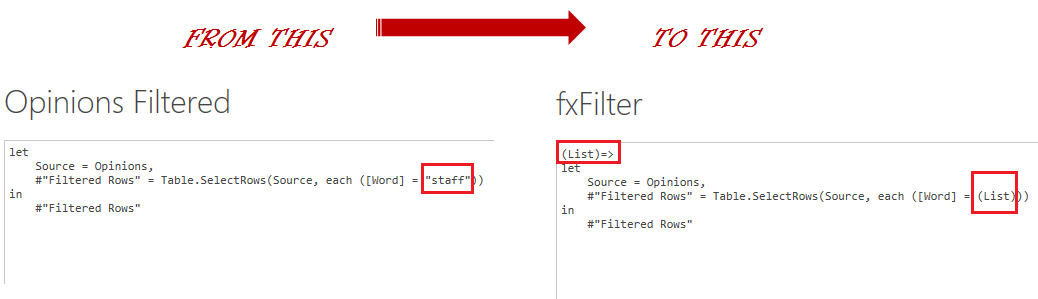
After we create the function, we rename it as something more user-friendly (I used fxFilter).
Then we load our LookupWords table into Power Query (From Table):
Next, we Add Custom Column. (Note: in Excel 2016, you have to Invoke Custom Function.)
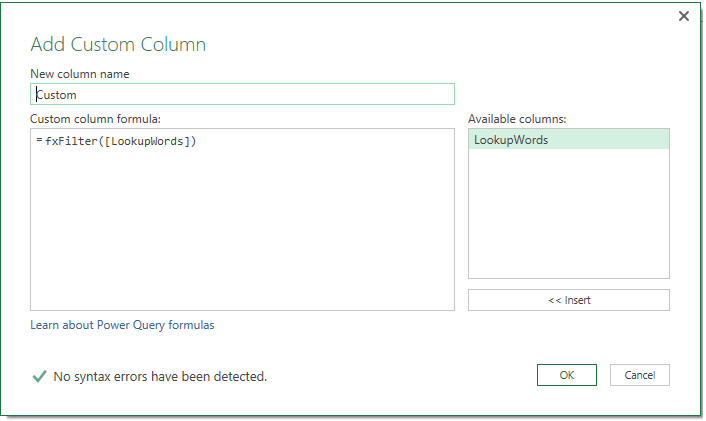
And when we expand the table, we get all rows that contain the words from our lookup list.
Identifying Connected words
We now need to split the Sentence column again to identify the words that were most often used in sentences containing our Lookup words. I call these words ‘Connected words’.
There are some final steps such as eliminating words that appear rarely (i.e. less than 5 times), removing duplicate rows, rearranging columns etc. that I will skip.
Our final table is on the left below:
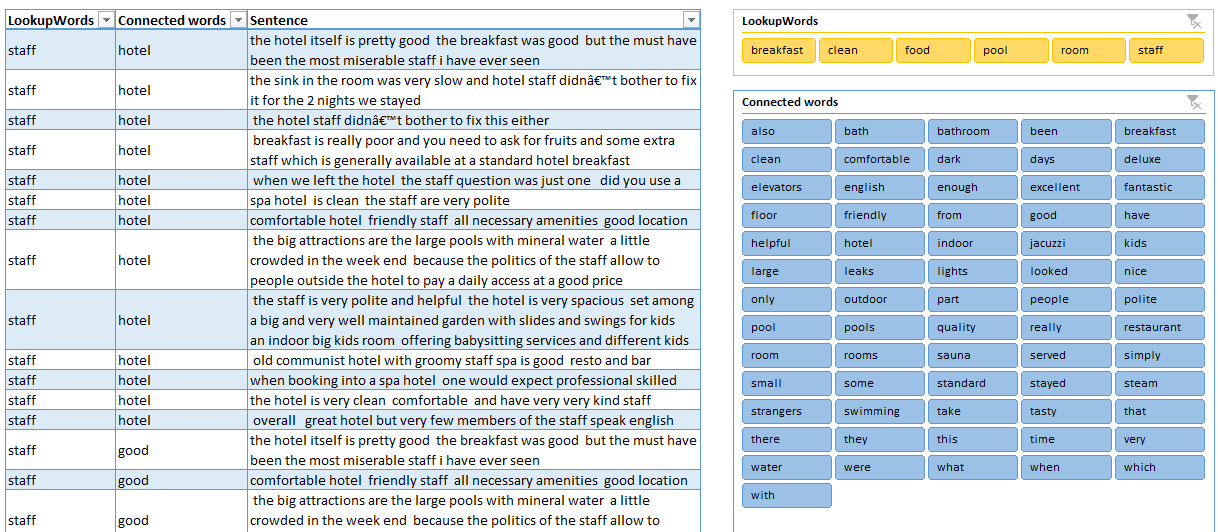
Analyzing text
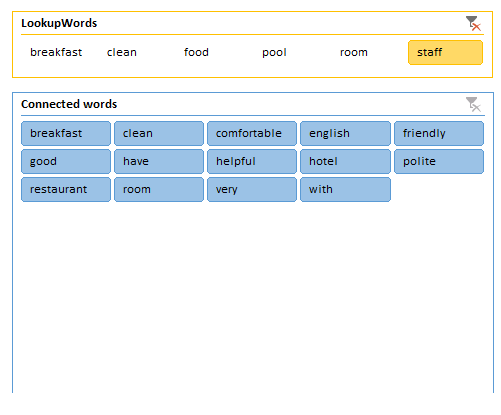
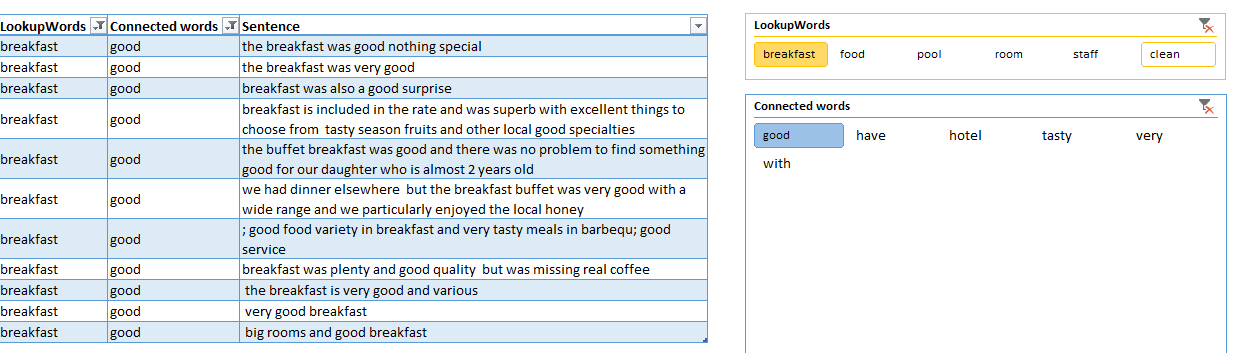
As you see, I added two slicers to our table - one for our Lookup words and one for our Connected words. By using them in combination, we can get more insights quite easily. For example, these are the words used most frequently together with ‘staff’:
Here, I have filtered for the Connected word ‘friendly’, which gives us just 10 rows to read:
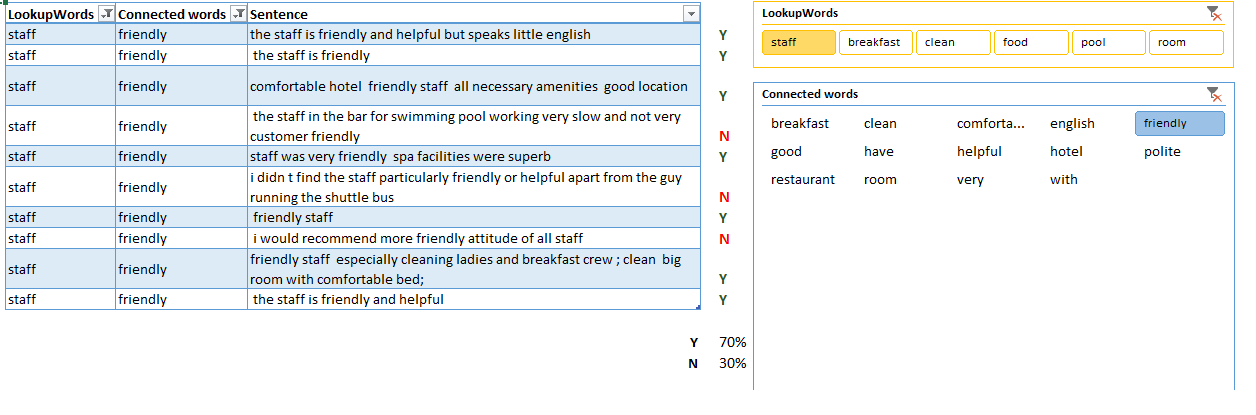
In a separate column, we can manually type “Y” for each positive opinion and “N” for each negative. Now we can calculate that 30% of mentions are actually negative. This is a simple way to quantify and measure our data. And it takes just few minutes to find out that the picture is similar with ‘helpful’ and ‘polite’ – positive feedback is prevailing.
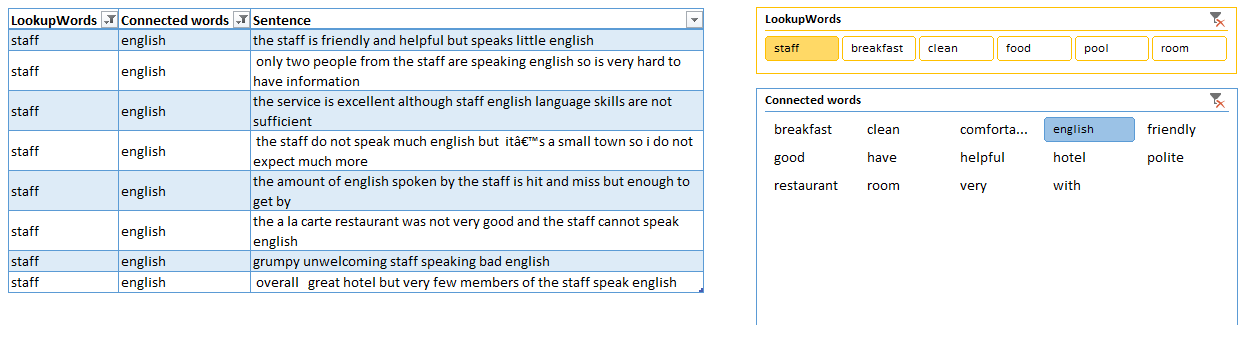
When we filter ‘English’ it is easy to see that 8 people mentioned staff speaks no or poor English. That directly calls for some action - we need to train our staff in English. If you were reading through 300 opinions, you might miss this quite easily.
It takes just few clicks and couple of minutes or reading to find out that clients are happy with the breakfast:
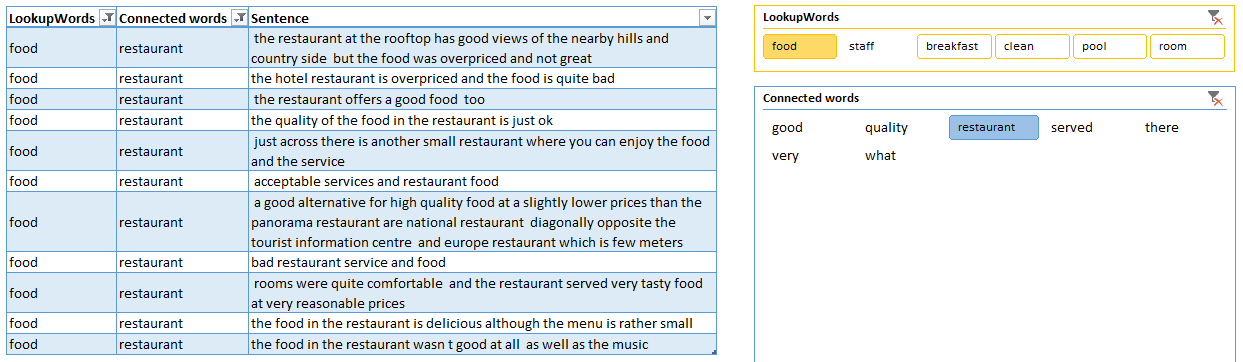
But are disappointed by the prices and quality of food in the restaurant:
Of course this is just a starting point and each of the above observations needs further investigation and analysis. But the key takeaway here is that we can successfully use Power Query to summarize unstructured text data. We can then focus our attention on sentences that contain the most commonly used words instead of reading the whole bunch of reviews.
Applying the technique
Many other ideas come up into my mind of how we can use this for further analyzing text data. We can use the Stayed column to study trends in time, we can quantify some key words (as shown with 'friendly') or make a word cloud showing our top 20 words. What are your ideas - how can we use Power Query and Excel to analyse unstructured text?
Example File
Kolyu has graciously shared the Excel file he used for this analysis, which you can download here.
21 thoughts on “Analyzing text with Power Query and Excel”
Great lesson as always, analyzing text should be in every analysts back pocket now a days.
I will admit I wasn't a big fan of all of those Replace steps in the query - I figured it would be easier to just write a UDF to handle this, and future, issues - a below link for those whom may be interested in having it in their back pocket.
Link: https://pastebin.com/n0UQjMQw
You could certainly add an optional parameter and point to a list or table - but in the following code I defaulted to the above solutions.
Hey Alex,
Easier depends on knowledge, of course. 😉
Very nice Ken, thanks for sharing. With the new fuzzy matching logic released this week, your post prompted me to think that you could possibly create a list of stop words (very, with, there) in a table and then use the fuzzy matching logic with substitution table to replace these words with null, then filter them out.
Just an idea 🙂
Really good data science approach using Power Query Ken. Thank you
@ken - don't blame me! I learned from the best with "M is for Data Monkey" and the Excel Guru website haha
Love the articles, they have definitely become a must read for me whenever they are released.
Great post as always! Though, I am not sure I agree with filtering out words with three letters, since the important ones (in terms of rating) such as 'bad' or 'not' will be removed from the list. For example, when you click on the lookup word 'breakfast' there may have been 'bad' in the connected words section - and it may have been more prevalent than the connected word 'good'.
Just a thought!
All good Alex! 🙂
Good point Matt!
I like it, who needs all that Machine Learning Sentiment Analysis stuff when we have Power Query !
I fully agree with Alex Powers - all replace steps could (and should) be automated. I would follow the approach used with filtering the lookup words - using custom function.
However, I decided to skip this in order to keep the article short and up to the point - how we can use Power Query to speed up process of analysis of unstructured text.
The point of Emily Chen for keeping words with 3 letters is worth to be considered, though it is pure technical decision.
By the way, my experience shows that look up words have to be nouns. For example 'food'. There is food in the reastaurant and we want to see what people think about it. If they think it is bad - than 'bad' will come up in our list of cennected words.
Finally, there is one step of text analysis that is not touched at all in the article - automation of coding. Coding is the process of grouping the issues in categories in order to quantify and measure the results.
An example of coding is demonstrated with the word 'friendly'. However, this is purely manual process that requires each and every sentence to be carefully read. I am sure there is a way to optimize it using Excel tools.
I guess this gives food for thought for another article. Any ideas in this regards would be highly appreciated.
Very nice!
Thank you!
Can you post the excel file?
Tnx
Excellent lesson.
In connection with keeping or discarding tokens based on length, I'd like to observe if some attention were given to plural endings, Pool and Pools at rows 8 and 20 if they been "singularized", would have rocketed to row 2 right between Hotel and Room after Very, giving Pool more weight in analysis.
This is great! HOWEVER, on the step of splitting the column by delimiter, each occurrence... my result only has two columns, rather than the actual number of columns there should be, so what am I doing wrong?
I manually entered guess-numbers into the "number of columns" field... is there a way for the system to KNOW how many columns there would be if it created one for each instance?
Pingback: How Power Query is the Excel myth buster
Great approach!
Any chance of sharing the workbook? I have trouble recreating the last few steps.
any additional resources to help with the steps from filtering lookup words to analyzing texts. I am struggling in connecting the dots from the instructions. This has the potential to really help a project I need.
Hi, many thanks for your comment.
I sent the file to you via e-mail.
Hope this is useful.
Hi Nik,
I sent the workbook to your e-mail.
Hope this is useful but in case of further questions - you can contact me.
Thank you very much for this article. I cannot seem to get the same result, any chance I could receive the Excel file?
Hi Jonathan,
I've updated the post to attach a copy of Kolyu's file. Just scroll to the end of the content, and you'll find a link to download it. 🙂