If you've worked with Power Query in Power BI, you've seen Column Quality and Distribution features already. But I'm super exited to say that I've finally received it in the Insider build of Excel!
What are the Column Quality and Distribution Features??
If you're not familiar with these, let's break them down a bit:
Data Quality Indicators in Column Headers
In its most simplistic form, you'll see that you now get an indicator in the header of each column as shown here:
Notice that red bar at the top of column C? That's happening because there is an error in the column! This is SUPER awesome, as we've been teaching for years that you have to scroll down looking for errors each time you change from text to a numeric data type. This should really help, as the column header will make it obvious that something went wrong. All green? You should be good to go. See red? You've got potential problems to deal with. (To be fair, you may still get errors after loading, as it is working with a data preview, but still, this will be a BIG help.)
The nice thing about this is that it is always on. Nothing needs to be set up to enable this by default. (And so far as I know, you can't turn it off - but then why would you want to?)
The Column Quality Feature
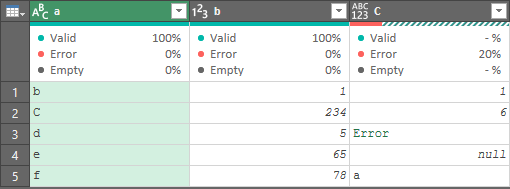
This one is enabled by going to the View tab and choosing "Column Quality", resulting in a view that looks like this:
Which adds 3 new lines to the top of our columns:
Now, I don't plan on leaving this on all the time. However, the cool thing here is that I can very quickly identify that 20% of my data rows in column C are errors. And while I don't have any empty rows, it would show me that at a glance if I did.
The Column Distribution Feature
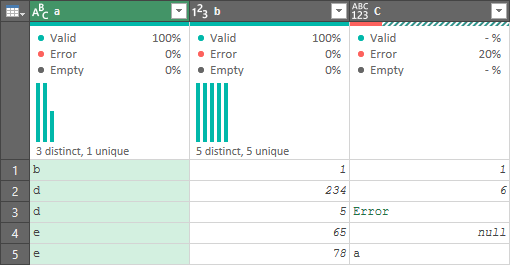
The idea behind the Column Distribution feature is to give you a quick glance at the distribution of values in your columns. Is there a single value that shows up more than others, or is the data uniformly distributed? This can help you quickly identify if the data has any consistency to it or not:
Notice that in Column a, we have 3 distinct values (b, d, e), but only one value that is truly unique (b only occurs once in the entire data set). Meanwhile, in column b, each value occurs in the data set once and once only, with no values appearing more than this. On a data set this small, this isn't going to be super insightful. But say you are pulling in data that spans your monthly summaries for the last year. If suddenly you see 13 values where you are expecting 12... that's a good indicator you might want to look a little deeper.
Something else that is worth noting is that you don't have to keep the Column Quality on to get the Column Distribution chart. These features can be used together or individually.
The less obvious Column Profile Feature
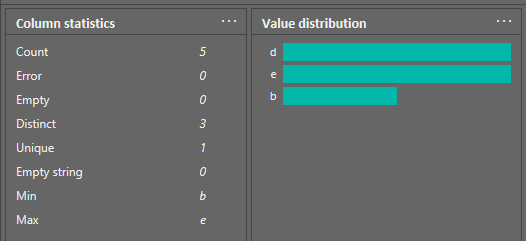
The final checkbox in the Data Preview menu is the Column Profile feature. This one is very cool as it only activates when you select the entire column. And when you do so, it takes over the preview window providing most of the information from the previous two settings.
We've got even more stats (although I wish it also showed the % of values like in Column Quality), as well as the value distribution chart.
What I love about this is that it can be called up on-demand by selecting the column, but doesn't get in my way when I don't need it.
My Thoughts on this Feature
I've been waiting for this to hit Excel for over a year now, and am SUPER happy to see it finally show up. Personally, I'll be running with Column Profile (the last option) selected, but not Column Quality or Column Distribution. The reason is pretty simple... I want to minimize the amount of info between me and my data. The Column Profile feature will give me what I need in an on-demand fashion when I see the data colours change at the top of my column. 🙂
How do I Get These Features?
This feature is so hot and fresh that it showed for Office Insiders this morning (v1910 build 12112.x.) So you need to get to that version as a minimum to get these features. Hopefully it will start rolling through the regular update channels next month!


14 thoughts on “Column Quality and Distribution Features are Finally Here”
This is super exciting !! I am desperately waiting to get my hands on it !!
Will this be added to standalone versions of Office, or are we all aboard O365 now?
That is a great question, Philip. My guess would be O365 only, but I'll check as they still do some Power Query updates for older versions.
Hi Ken,
Any updates on the question on access to this feature outside O365?
I have just spent the last hour trying to get it to no avail.
Hi Bob,
It's there, it's just rolling (slowly) through the channels. It's been in Insiders for a few months, and as far as I know has now also hit the Monthly channel as well. If you go to File -> Account, you should be able to see the channel you're on.
Hi Ken - when profiling the top 1000 rows, it seems that the Column quality feature only 'scans' those top 1000 rows - is this true? In my example, my top 1000 rows are blank values for column A, and so the Empty bucket shows 100%. However, when i expand the column to show all values, there are indeed other values besides blank, or empty. Can you confirm this is the case? If so, it would seem that it is misleading. I am testing this in my Power BI desktop file. Thanks!
Hi Christopher,
That's correct. At the bottom of the screen, it actually even says that it's doing the top 1000 rows. Click that and you can change it to the entire data set though.
Hi,
I do not have these options related to column quality in my View tab in Power Query 🙁 I wonder why? Would you be so kind as to help me with this issue?
I have Ms-Office 2019 Pro Plus.
Many thanks in advance!
Jacek
Hi Jacek,
It's due to the fact that you don't have the most up to date Power Query features. I believe that this should be available for Excel 2019 though. To get it (if I'm right), you'd need to go to your Windows Update settings, go to the Advanced settings, and make sure the box for "Get updates for other Microsoft products when I update Windows" is selected. Then check for updates and install any Excel updates.
I believe that this should take care of it for you.
Dear Ken,
first of all I'd like to thank you very much for your time. I do really appreciate it! Thank you also for you valuable hints. The strange thing is that I have checked updates and as Ms-Excel shows, everything is up to date - the window appears with info "You are up to date! The latest version of Ms-Office is installed". I do wonder if maybe there is an option I have to select to have these Column Quality features available? I have no idea what to do...
Anyway, thank you very much again for your effort and help!
All the best!
Jacek
Hi Jacek,
I've reached out to Microsoft to get some clarification on this, as my understanding is that Excel 2019 should receive these updates. It could take time, but given that we're a year since the original release, I'd expect it to be there by now.
Dear Ken,
thank you for your effort! As you can see, based on the info from Microsoft everything should be OK, but it is not! I am confused because the system should already have these features but it doesn't have them 🙁 As far as I know Ms-Office Professional Plus is equipped with Power Query and during update it also should be updated. I have Power Query fully functional, but I do not have these Column features...
Regards & thanks a lot for your involvement and help!
Jacek
Dear Ken,
one more thing I've found is that I do not have color coding in M language statements, as well as Intellisense mechanism when typing the code. As far as I know these should also be available in Ms-Excel 2019. Am I right? Maybe this would be the hint what is wrong...?
Regards!
JJ
Pingback: Minhas impressões e dicas para a certificação DA-100 - Tadeu Mansi