Recently, a reader commented on a blog post that I wrote back in 2015. Their question essentially boiled down to working out how to label duplicates with Power Query. As an additional twist though, they also wanted to ensure that the first naturally occurring data point was never accidentally labelled as the duplicate. As Power Query often re-sorts data at inopportune times I thought it was worth a look as to how to accomplish this.
The Goal: Label Duplicates with Power Query
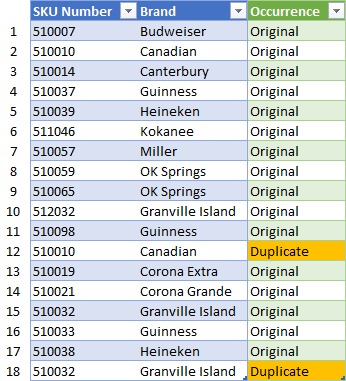
Our original source data is shown in blue columns below, with the green column on the right being the one that we want to add via Power Query. (The white column on the far left contains rows numbers. They aren’t actually part of our source data at all and are only intended to make it easier to follow the explanation below the image.)
The important things to notice here are:
- Row 2 of the table records the initial entry for SKU 510010 (Canadian), with a duplicate on row 12
- We have an original entry of SKU 510032 on row 15 and a repeat on row 18.
The key thing that we want to ensure as we flag the duplicates in this scenario is that the sort order is always retained as per the original order of the data source. While you’d think this shouldn’t be hard, the reality is that there are many occasions where Power Query will re-sort your data on the fly, and we cannot let that happen here.
Getting Set to Label Duplicates with Power Query
The way I would approach this task – providing that the data has already been loaded to Power Query – is to do this:
- Add an Index Column --> From 1
- Select the SKU column --> Transform --> Group By
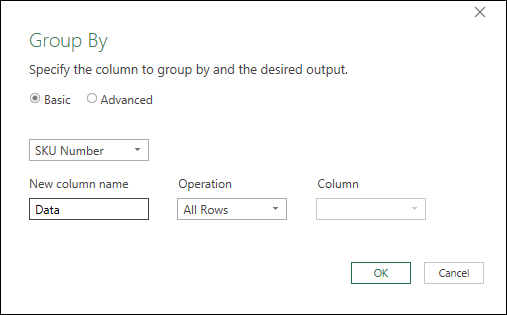
- Configure the “New Column Name” to call it “Data” using the “All Rows” aggregation --> OK
- Go to Add Column --> Add Custom Column and use the following formula:
- Table.AddIndexColumn( [Data] , "Instance" , 1 )
- Right click the Custom column --> Remove Other Columns
- Expand all columns from the Custom column
Now, if you’ve been following my work at all, you may recognize the data pattern I just used. It’s called Numbering Grouped Rows, as is available as one of the Power Query Recipe cards and is also illustrated in Chapter 13 of my Master Your Data for Excel and Power BI book. The result is a data table that looks like this:
As you can see, the Index column preserves the original row numbers of the data set. In addition, the “Instance” correctly records the order of their appearance in the data set.
Applying Labels to the Duplicates
This is the easy part:
- Go to Add Column --> Conditional Column --> name it “Occurrence” and configure it as follows:
- if the Instance column equals 1 then return the Original column else return the Duplicate column
- Sort the Index column --> Sort Ascending
- Select the Index and Instance columns --> press the DEL key
- Set the data types of each of the columns
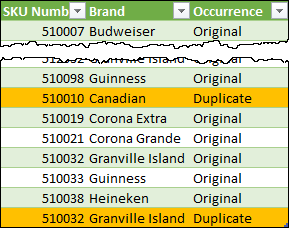
And that’s it. The data points have all been labeled and can now be loaded to the desired destination:
If you'd like to play with this scenario, you can find the completed sample file here.
Learning More
I love data patterns and include a ton of them in Master Your Data with Excel and Power BI, our Power Query Recipe cards. Both of those resources are also included in our Power Query Academy video course as well, where you can actually see them performed live. I have to say - of all the recipes I have - Numbering Grouped Rows is one of my particular favourites. It has a ton of utility in all kinds of scenarios.


6 thoughts on “Label Duplicates with Power Query”
Great solution. time-saving and more straightforward than other scenarios that I saw on the web.
You might want to consider adding a table buffer command. I have used your technique, but sometimes Power Query does "lazy" evaluations and jumbles the sort order during the grouping process. Without the table buffer the row with index 1 might not be the first one.
Hi Bill,
That's interesting... what data source were you using? One of the interesting side effects of adding an Index column is that it should always break query folding and preserve the sort order of the data. I'm curious of scenarios where it does not do this....
As always - there's more than one way to skin a cat.
Since the SKU Number is key value for duplicates in this scenario, you can use the "Running Totals" pattern to help find the duplicates with a little M-Language know-how.
After adding the Index, you can add the following custom column to find the duplicate SKU #'s
= Table.AddColumn(#"Added Index", "Duplicate", each if List.Count(List.Select(List.Range(#"Added Index"[SKU Number],0,[Index]), (r) => r = [SKU Number])) > 1 then "Duplicate" else "Original")
Hey Nick,
Did you add that as a custom column or a new step? Either way, for me it flags every line item as "Original" whether it is a duplicate or not...
It was added as a custom column
Not sure how to post images here, so here's a link to a screenshot in imgur.com
https://imgur.com/duplicates-power-query-pfdarnp