(Please note that this blog post is from 2017, so the dates included below were for our very first boot camp. For dates and information on current sessions, please visit http://xlguru.ca/data2dashboards.)
I'm pretty excited to announce that we have our very first Power BI Boot Camp coming up in Vancouver, BC on Feb 22-24. This is something that I've wanted to do for a while, and it's going to be awesome!
The boot camp is going to be 3 full days of hands on Power BI, and is intended to get you up and running, building cool solutions that will impact your business.
Why do you care about the Power BI Boot Camp?
Okay, I get it… you're an Excel person, and while you've heard of Power BI, you're not quite sure if you need it or not, and certainly don't know if you can justify the cost of a 3 day Power BI Boot Camp...
I honestly believe that the answer to both questions is an emphatic yes!
Top 5 reasons you need to learn about Power BI:
We'll cover the "how do I convince my boss" near the end of the post, but first, let's talk about what Power BI is, and why it is relevant to you.
- A major reason that companies are behind in their Business Intelligence development is that they are using outdated versions of Excel and cannot (or are afraid) to upgrade. Power BI Desktop is a separate program that sits completely outside Excel, meaning that you can run the most up to date business intelligence tool DESPITE the version of Excel you're stuck on. I'm looking at you Excel 2003 & Excel 2007 users.

- You can do a TON of stuff with Power BI for free. Yes, there are services that cost a nominal fee, but you'll be surprised at how much you can do for absolutely nothing. The investment you make here will pay back in spades as you begin to automate tasks that were taking you huge amounts of time, and get the ability to deliver true business intelligence to your stakeholders.
- Power BI's data collection experience is based on Power Query, and it's modelling experience is based on Power Pivot. So if you have those skills from your Excel journey, they will be totally relevant in Power BI. And if you don't? The new skills you learn at this course related to these areas are portable back to Excel as well. (So again, if you're stuck on an older version of Excel, this is your chance to upskill BEFORE your Excel is updated.)
- If you've ever tried to share Excel dashboards, you know how hard it can be to do so and maintain them. And if your end users want their reports accessible and interactive on mobile? Forget it. But Power BI solves these issues, including delivering interactive reports to your mobile phone (yes, even your non-Windows phones!) Rest assured, however, that if your company is cloud averse, this tool is not dead to you, and it's still worth coming.
- You'll be learning in a small class environment from a world class expert who cares about delivering value. I've been there. I know how hard your job is. And I want to help you become more effective. That is what my company is all about, and I'm very serious about it.
What will the Power BI Boot camp cover?
To be completely honest, the better question is probably "what won't we look at?" I've got all kinds of stuff cooking for this. When I first started drafting the Power BI Boot Camp outline I was wondering how I'd ever fill 3 full days. Now I'm trying to figure out what to cut so that I can fit it all in. Keep in mind that it's not going to necessarily be in the order below, as some topics are MUCH bigger than the summary I'm providing, but here's a bit of an overview…
Where it all starts…
We'll start by building a basic Power BI solution built on an Excel file. Some minor data modifications, some cool visuals and then publishing it to the cloud service, we'll walk through the most basic of Power BI journeys. I want to do this so that you can see just how easy it is to build a cool solution that works and interacts, like this one. (Go ahead... click any of the bars and see how it cross filters in your web browser!)
More data, more transformations, and some modelling…
From there we'll start to dive deeper, teaching the techniques that allow you to build more robust models and solutions. We'll spend a bunch of time looking at different data sources, as well as some of the more complex methods for fixing bad data to make sure that you can use it in your solutions. We'll also show you how to link these tables together so that they filter nicely across multiple visuals.
Let's get visual…
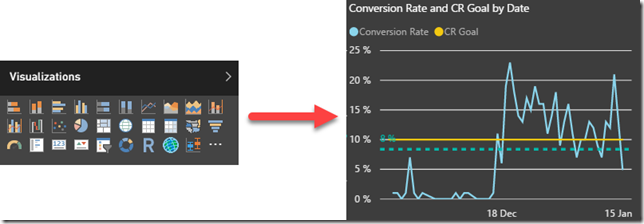
Power BI is all about getting visuals with your data. It has a big collection of visuals, as well as an ever growing gallery of custom visuals as well.
While I won't promise that we'll look at each different visual in the product (we only have 3 days), we are going to look at a lot of them, including some of my favourite custom visuals. I want to show you how to create them, format them, and what data you need to get the best of them to work.
We're building dashboards to tell a story here, so I want to try and get that as close to real life as possible for you. From bar, column and line charts, to maps and bullet charts, I really want to get you comfortable with these, as well as how to control the interactions between them.
And speaking of Dashboards… do you know the difference between a report and a dashboard in Power BI? That will get clearly explained here as well.
Getting the numbers right…
We'll get into working with the DAX formula language, and understand how to add and override filter context to make your formulas show exactly what you want when you filter any visual.
How about Calendar intelligence? I have a huge passion in this area too. The Power BI Boot Camp won't just teach you how to build your own calendar table, you'll also leave armed with a collection of DAX calendar intelligence measures. Those measure patterns are super important as they'll allow you to report results correctly when you ask for Month to Date data or Month to Date for 2 months ago.
Sharing is caring!
We'll look at sharing via the web first, both for internal and external users on an invite-only basis. But even more, I'm also going to walk you through embedding your reports in a web page so that you can show the world how awesome your company is.
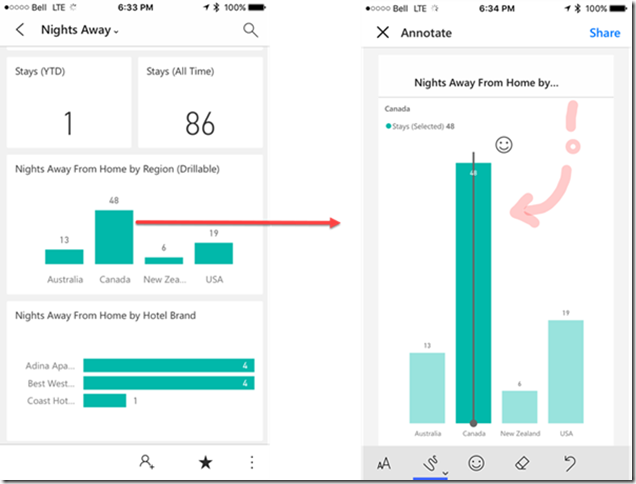
In addition, you'll want to bring your phone with the Power BI app installed. Why? Because I'm going to make sure you get set up with your reports and dashboards delivered to your phone in a mobile optimized fashion where you can even annotate your reports by hand.
And if you'd prefer not to be cloud based? We'll look at creating Power BI templates that you can distribute within your organization as well.
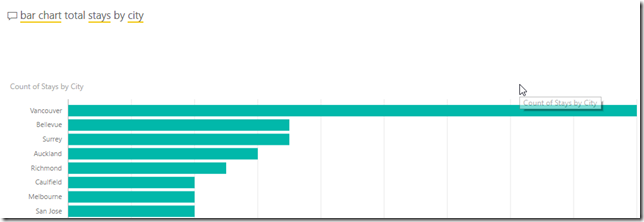
You know… while we're talking about sharing… have you ever sent a report to a manager only to have them come back with a one of those "can you show me this?" type questions? Let's try and solve that little problem by allowing our manager to ask their own questions using natural language queries. In other words, how cool would it be if your manager could just type "Bar chart total stays by city" and it did it, even if you've never built that report? Because they can.
And what about updates and security?
Wait… how do I keep this stuff up to date? And how do I ensure that only the right people are looking at their data? Well of course we'll cover those topics!
Not only will we look at scheduling refresh for cloud hosted data sources, but also your on-premises data sets via gateways and 3rd party applications. Ooohh… connecting data to the cloud… can I hear anyone saying "Security!" Well yes, so let's talk about both encryption and also how to restrict the data sets to show only relevant rows to the correct people. (And let's face it, you will want that last part even if you keep your data local!)
So why Ken's Power BI Boot Camp then?
My goal is to deliver real value to you. Anyone who has been to any of my courses in the past knows this:
- It's virtually impossible to find someone who has more passion for what they teach than me
- We limit the class size so that it doesn't get too big. A huge part of the reason for this is because…
- My style is to roam the room and help people keep up with the content so that everyone learns
- I provide completed examples for all the work we go through, with catch up points along the way, just in case the above isn't achievable
- I provide a ton of supplemental resources as well
I've been to classes before, and I know that it can be somewhat difficult to apply the course materials to your own work. For that reason the Power BI Boot Camp is designed like all my courses: We will build solutions like you'd expect to do so in the office, exposing the pitfalls where the software doesn't work as you'd logically expect. This is intentional, as we teach you not only how to do things correctly, but also how to debug problems as they happen.
What skill set do you need?
Do you need experience working with Power BI in order to come to the Power BI Boot Camp? Heck no, that's what this course is about! And while some Excel knowledge is helpful, you're certainly not going to see a test on Excel functions here.
Ultimately what you need is a hunger to learn; a desire to change your reporting world. If you can bring me that enthusiasm, I'll teach you what you need to know in order to make that happen.
Making the Case to Your Boss
I managed an accounting department in my former life, so I totally get this. We're all about data here, so here's the up front details:
The cost of the course is $1,495 plus GST. It includes your breakfast and lunch all 3 days, but you need to look after your dinner and hotel room (if necessary). So now you can work out the total cost.
I'll let you do the math and work out how many hours per week you need to save yourself in order to break even. If you spend a significant amount of time cleaning up data to be used in Excel, you'll find that you'll break even on this alone.
Honestly though, the true value proposition of this course isn't the ability to break even on a labour basis, it's about the opportunity costs. Opportunities like:
- Identifying programs that are costing your company money which don't earn returns.
- Finding the best paying leads to pursue for greater sales.
- Delivering value to your stakeholders when and where they need it.
- Reducing inventory during slow seasons to reduce carrying costs.
- Highlighting key metrics that are under performing.
- Building solutions to blow the minds of your clients or stakeholders.
Every business is different, but ultimately it's the opportunity to get better information into the hands of those who make the decisions, be it you or your boss. That benefit FAR outweighs the price we charge, and will break even for you VERY quickly.
I hope to see you at the course. It's going to be awesome, and it will change your data life forever. 🙂
Register for the Boot Camp here.


10 thoughts on “Power BI Boot Camp”
Ken and Miguel, first, thank you for providing the Power Query live on-line course last year. I was in the first session. The knowldge gained from that session and the "M is for Data Monkey" hard copy book that I later purchased was invaluble to the DAX-intensive BI projects that I worked on last year and continue to work on. I am one of those people aprehensive about the transition to Power BI. The reason is that right now I'm heavily invested in complex table relationships, DAX code and DAX queries. I have applications that take query tables in and out and in of the data model. Pivot-based reports are generated by Power Pivot DAX measures, and lists by DAX queries and DAX measures. The question is can I still do all of this using Power BI?
Hey Bob,
The only part that I hesitate on is the part you mention about "in and out of the data model".
Power BI uses Power Query to read the data into the data model, and the modelling layer is Power Pivot. So basically, the relationships are the same (actually there are more options in Power BI,) and the DAX is the same as well. The big difference is that - today - there are only tables (not PivotTables), but there are a HUGE amount of visuals to move more towards dashboards. Plus there is a huge benefit in the deployment scenario.
In my opinion, Power BI is for reporting, Excel is for analysis. So basically, the answer is "it depends on exactly what you're trying to do".
Ken,
I sometimes need to query the data model and place the results in Excel and either 1) modify it in Excel and load back into the data model, or 2) reload it into Power Query, e.g., to append or merge data.
The Pivot tables are really important for my analysis tasks. Regarding Power BI, the big question is whether or not to give-up use of pivot tables.
Regarding visualization, I think you're saying it's better to use Power BI instead of the Power View add-in to Excel.
Yes, so different tasks. If you need to modify the source data then reload it, you need Excel. Power BI is for re-shaping and reporting on data, not modifying data. And yes, moving away from Pivots is... an adjustment.
Re the visualizations though... AVOID POWER VIEW. It's been hidden in the ribbon in all versions of Excel. It's old, and it's not the direction Microsoft is going. Power BI is so much better in that case.
So here's what I'd do. Use Excel to pull, land, and reshape and modify your data. So long as you land it in an Excel table, it will then be easy to pull into Power BI for your high level visuals.
Ken, Thanks for the advice. I hope you hold a Power BI class in the Washington, DC area.
Pingback: Don’t Miss Out – One More Week to Sign Up for Live Power BI Training with Ken Puls – Bacon Bits
Looking to set up a private course on Pivot Refresher and Power Pivots in Coquitlam (for Seon Design Inc.). Can you please email me with phone number/email? Looking to set up for about 10 people. Please advise.
Hi Debbie,
Thank you for your interest. I believe someone from our office has followed up with you by email, but please feel free to contact us through the website if needed. The contact form is available at: https://www.excelguru.ca/forums/sendmessage.php
Will this be from the 22-24 or 26-28? On the microsoft site I saw in the events tab 26 -28. Here it states 22-24. let me know.
Hi there, Thank you for your interest in the Power BI Boot Camp. The dates in this blog post were from our very first boot camp held in Feb 2017. Our next upcoming session is running on Feb 26-28, 2018. More information and the registration link can be found at http://xlguru.ca/data2dashboards.