Are you ready for Power Query Challenge 6? In this challenge we'll look at splitting nested data sets into a nice table in First Normal Form.
Let's take a look at Power Query Challenge 6:
Where did the challenge come from?
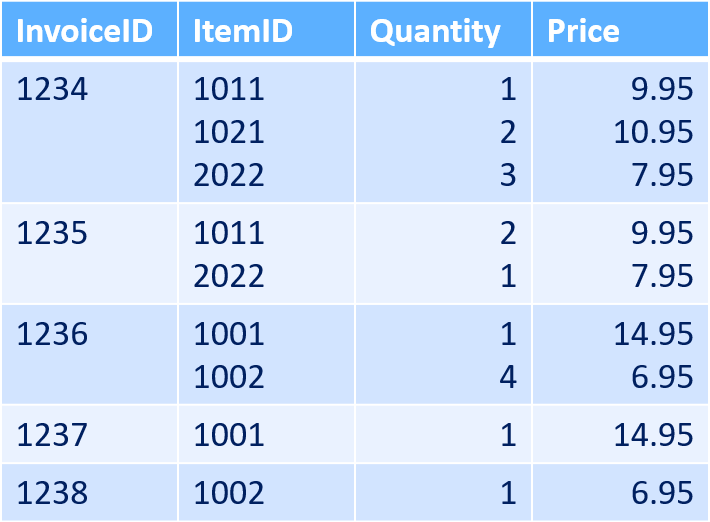
The inspiration for this challenge came from last week's Self Service BI Academy that we hosted in Vancouver, BC (you should have been there, it was awesome). At the outset, we talked about how to identify if your data is in First Normal Form (the format that is ideal for a PivotTable), and I showed this data set:
Notice how the invoice has multiple ItemID, multiple Quantity and multiple Price fields per cell? That's not good at all.
What we Really Need - Data in First Normal Form
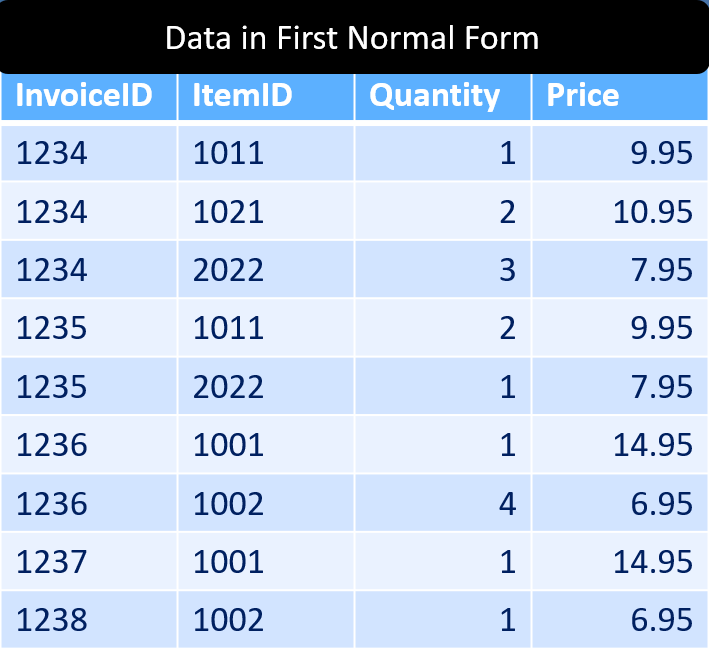
As I explained in the Boot Camp, it is essential that the data source be in First Normal Form in order for a PivotTable to consume it. What does that mean? It means that it needs to look like this:
Notice that in this case the data is atomic - it only has one data point per cell. In addition, there is now one complete record per row. The InvoiceID shows on every row now, and each data point has been correctly split up and applied to them.
So what's the thrust of the Power Query Challenge 6?
Well, as it turns out this is a bit tricky. There are a few issues at play here:
- The data is separated by line feeds within the cells
- There are a different number of line feeds in each row
- At least the number of line feeds is consistent for each cell in the entire row though!
So the challenge is this: break the table apart so that the data is in First Normal Form like the second image.
You can download the data source file (and post your solutions) in our forum here. I'll give you my version tomorrow.


3 thoughts on “Power Query Challenge 6”
The forums are not allowing me to post the solutions despite registering
let
Source = Excel.CurrentWorkbook(){[Name="Data"]}[Content],
mChgTyp = Table.TransformColumnTypes(Source,{{"ItemID", type text}, {"Quantity", type text}, {"Price", type text}, {"InvoiceID", type text}}),
mSplitColDL = Table.TransformColumns(mChgTyp, {{"ItemID", Splitter.SplitTextByDelimiter("#(lf)", QuoteStyle.Csv)},{"Quantity", Splitter.SplitTextByDelimiter("#(lf)", QuoteStyle.Csv)},{"Price", Splitter.SplitTextByDelimiter("#(lf)", QuoteStyle.Csv)}}),
mCombineCols = Table.CombineColumns(mSplitColDL,{"ItemID", "Quantity","Price"}, each List.Transform(List.Zip(_), each Record.FromList(_,{"ItemID", "Quantity","Price"})),"Merged"),
mXpandListCol = Table.ExpandListColumn(mCombineCols, "Merged"),
mXpandRecCol = Table.ExpandRecordColumn(mXpandListCol, "Merged", {"ItemID", "Quantity", "Price"}, {"ItemID", "Quantity", "Price"}),
mChgTyp1 = Table.TransformColumnTypes(mXpandRecCol,{{"ItemID", type text}, {"Quantity", type number}, {"Price", type number}})
in
mChgTyp1
In 11 lines of 'M' code
let
Source = Excel.CurrentWorkbook(){[Name="Data"]}[Content],
ChangedType1 = Table.TransformColumnTypes(Source,{{"InvoiceID", type text}, {"ItemID", type text}, {"Quantity", type text}, {"Price", type text}}),
DemoteHdrs = Table.DemoteHeaders(ChangedType1),
Transpose1 = Table.Transpose(DemoteHdrs),
SplitColDelim1 = Table.SplitColumn(Transpose1, "Column2", Splitter.SplitTextByDelimiter("#(lf)", QuoteStyle.Csv), {"Column2.1", "Column2.2"}),
SplitColDelim2 = Table.SplitColumn(SplitColDelim1, "Column3", Splitter.SplitTextByDelimiter("#(lf)", QuoteStyle.Csv), {"Column3.1", "Column3.2"}),
SplitColDelim3 = Table.SplitColumn(SplitColDelim2, "Column4", Splitter.SplitTextByDelimiter("#(lf)", QuoteStyle.Csv), {"Column4.1", "Column4.2"}),
Transpose2 = Table.Transpose(SplitColDelim3),
FillDwn = Table.FillDown(Transpose2,{"Column1", "Column2", "Column3", "Column4"}),
PromoteHdrs = Table.PromoteHeaders(FillDwn, [PromoteAllScalars=true]),
ChangeType2 = Table.TransformColumnTypes(PromoteHdrs,{{"InvoiceID", type number}, {"ItemID", type number}, {"Quantity", type number}, {"Price", type number}})
in
ChangeType2
Pingback: Solutions for Power Query Challenge 6 - Excelguru