This week's blog post on using Power BI when you're not a data person is a guest post by Rebekah Sax of Excelguru Consulting Inc.
Last week I participated Excelguru's first ever "Data to Dashboards" Power BI Boot Camp. Seventeen of us lucky attendees were introduced to the incredible power of Power BI. Just to be clear, I am NOT a data person. My background is in marketing and communications, which is the main focus of my role here at Excelguru. So I was a bit nervous about being the only participant that was not in finance/accounting, an Excel jockey or a data analyst of some sort. Would I be able to keep up with the class and learn this brand new platform? How could someone go about using Power BI when you're not a data person who usually works with numbers?
Welcome to Power BI
The boot camp consisted of three jam-packed days of hands-on exercises led by Ken Puls. We started off nice and easy with creating some basic visuals we are all familiar with, such as map, bar and column charts. By the end of the first day, we had learned how to build reports and dashboards using multiple data sources, and how to publish and share them. Later, we began writing DAX measures for filtering and shaping our data. This is where I learned that I CAN CODE! However, there is also a great feature called Q&A. This is a "query interface" which allows you to pull insights from your data using regular English, no coding required. For example, you can type in "number of locations" or "total sales in May" and Power BI will build you a basic visual that shows the information, pulled from your source data table.
For the last part of the day, we had fun playing around with cool custom visuals from the Power BI Custom Visuals Library. These are a great way to tell a story with your data by making it more visually interesting and engaging. Some of the options are a little whimsical. I mean, I don't know why I would ever need to represent data as fish swimming in a tank, but I could if I wanted to.
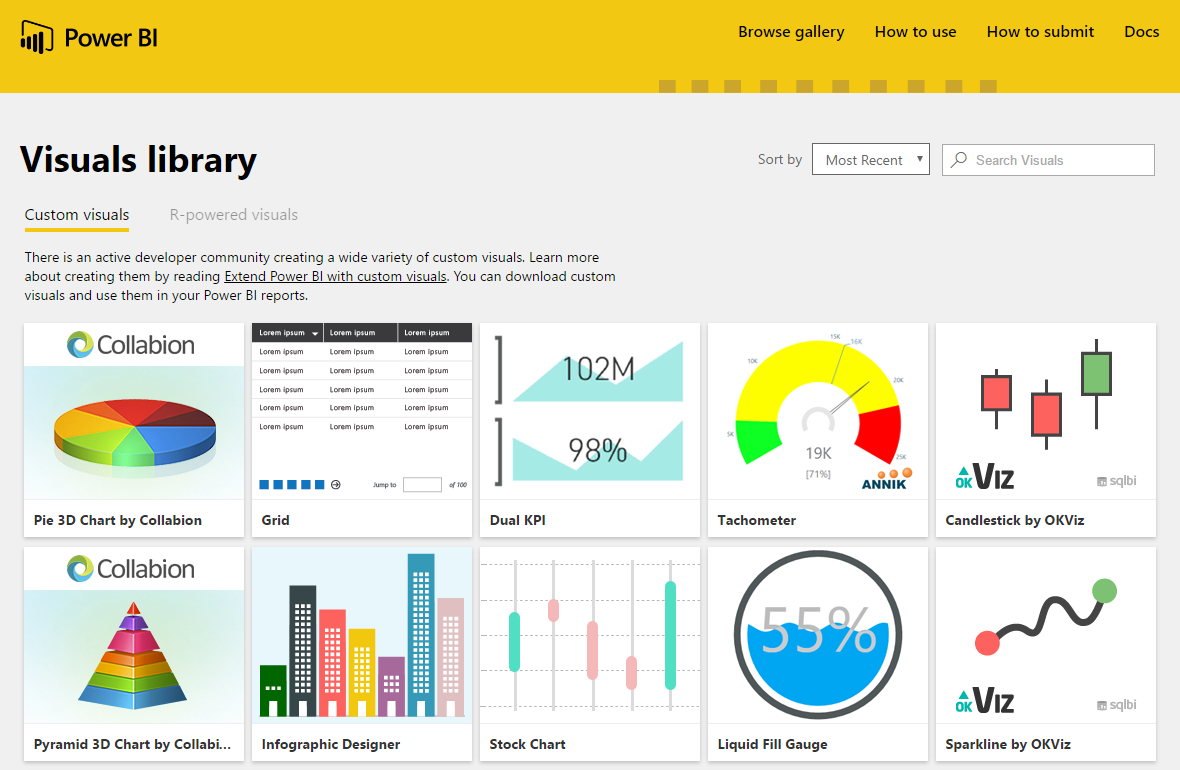
The number of custom visuals available in the Power BI library is really impressive, and many of them are free.
Cleaning and Working with Data
Our second day began by looking at the ways Power BI gets, transforms and loads our data using Power Query. This amazing tool is also used in Excel, so the techniques we learned are transportable between Excel and Power BI. I'm glad I had been previously introduced to Power Query, but some things were still challenging. For example, it took a while to wrap my head around Power BI's six different types of joins for merging two tables together. Luckily, I can use the copies of the example slides to use as a reference later on.

The "Inner" join type in Power BI. This join gathers only records which exist in both tables.
It was interesting to learn different techniques for breaking apart and recombining data from various sources into one cohesive data set. We also dove into formulas using M code (the Power Query language) and learning intermediate DAX measures (yikes, more coding!).
The Loaded Pencil
What really blew me away was when we started applying these measures to sales data from a fictional restaurant called the Loaded Pencil. First, we set up a calendar table and used the Calculate measure to start pulling out key metrics such as sales for a particular period. Another measure allowed us to compare to sales for the same period the previous year, quarter or month. Using different visuals, we easily filtered the data to view specific sales details. Our report even allowed us to look at the broad categories and then drill down right into specific items. We then set up cool visuals displaying food and alcohol sales as compared to budgeted goals. Now this was something I could sink my teeth into from a marketing perspective. I began to see real-life applications for using Power BI when you're not a data person!
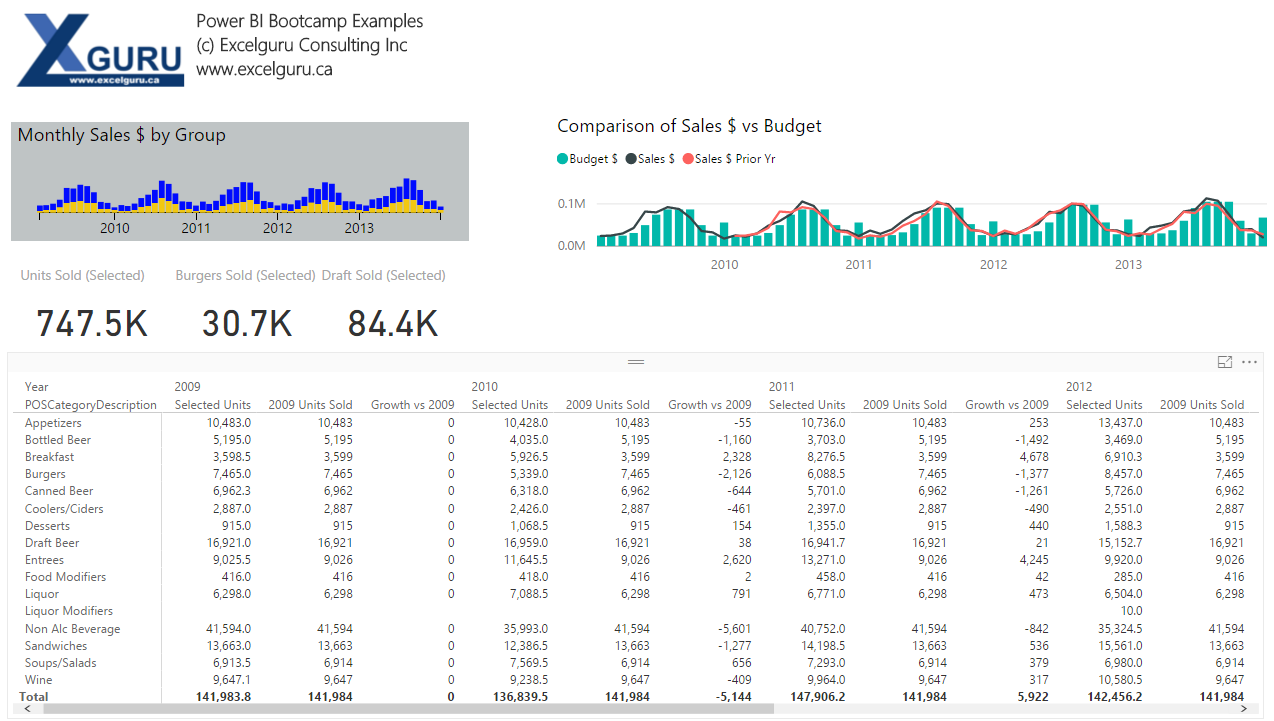
Sample visuals looking at the sales data from our fictional restaurant, The Loaded Pencil.
Taking It Mobile, RLS and Developing Like a SQL Pro
The first part of day three was really fascinating, where we focused on making our reports and dashboards mobile-friendly. Essentially, we built a mobile app displaying the outlets of a well-known coffee shop chain. It showed all the locations around BC and even let us target specific regions or cities, so you could find where to get your next caffeine fix. (Unfortunately, star points aren't tracked on this app, so I'll keep using the official one.) I could really the possibilities of mobile-accessible reports for a team with members regularly out of the office on site visits, client meetings, sales calls, etc.
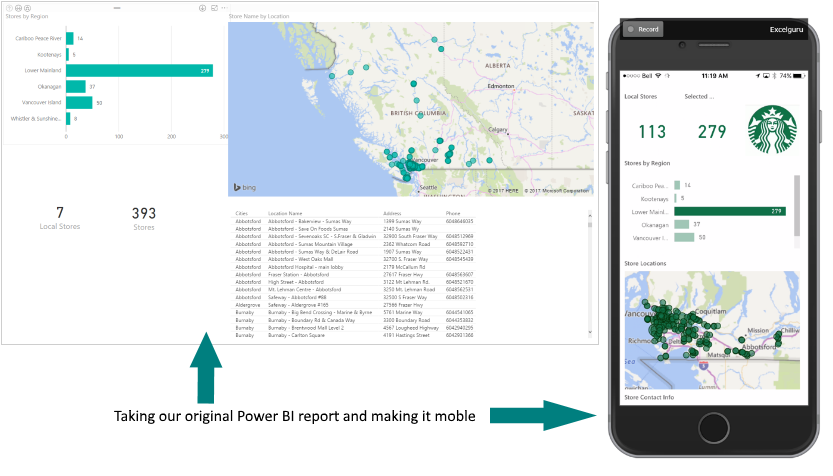
An example of our coffee shop Power BI Desktop report and the mobile-friendly version. Note that on the mobile version, the data set has been filtered to show just the Lower Mainland locations.
While the topic of Row Level Security are not something I need to worry about in my role, it was interesting to see the different methods that they can be created and applied to restrict the information shown to only that which a reader is entitled to see.
Using Power BI When You're Not a Data Person
One of the things that sticks out the most for me was chatting with another participant at the beginning of day two. She was so excited that she was already able to start using some of the stuff we learned the day before to her job. I have to say, my head was full to bursting by the end of the boot camp, but I did gain a few big insights:
- Using Power BI when you're not a data person to create a report can make it easier to present and understand the key information. This is especially true if you are like me and get overwhelmed by row upon row of numbers as on a traditional spreadsheet.
- Because you can move from the "big picture" down into specific detail with just a few clicks, you can make better connections and insights. You may even be able to pick up on something that has gone unnoticed but is having an impact.
- Being able to access precise, up-to-date information while on the go is huge. Imagine being able to answer a specific question right on site, without having to go back to the office and calling or emailing your client later.
Just remember, you don't have to already be an Excel expert to be able to use Power BI. It's certainly complex and can seem daunting, but the instruction here was fantastic and - if there's stuff that wasn't covered - it's great to know that there is also passionate community always willing to help someone trying to learn.
2 thoughts on “Using Power BI When You’re Not a Data Person”
Great recap Rebekah!
The opportunity of getting to know a few friends in the Excelguru community is also worth mentioning.
Thanks Jayson, it was nice to meet you at the boot camp. Opportunities like this are definitely a great way to meet others in the field and start building that support network for when you have a problem or challenge that you want to bounce off someone else! ~Rebekah