This week I was playing around with MailChimp and Power BI. If you’re not familiar with MailChimp, it’s the service that we use to send out our Monthly-ish newsletter. I thought I’d show how incredibly easy it is to get a dashboard from this service.
Software as a Service
MailChimp is what we refer to as a “Software as a Service” (SAS) setup. Basically what this means is that it is a subscription model where I have no need to set up my own server or host anything myself. I simply subscribed, set up the forms on my website for you to fill out, and then use their services to build and send out the newsletter. It’s pretty slick and they don’t even charge me until I hit 2,000 subscribers or want to set up auto replies and such. I’m a huge fan of this model, as it lets you do a “try before you buy” test, only upgrading when you want to.
What do you need?
There are only two requirements here:
- A MailChimp account of your own
- A PowerBI.com account which you can create for free (seriously, no Pro Subscription required)
Getting Started with MailChimp and Power BI
Step 1: Connect to MailChimp
So the process begins with signing in to your Power BI.com account. Once there, you look for this button in the bottom left corner of your screen:
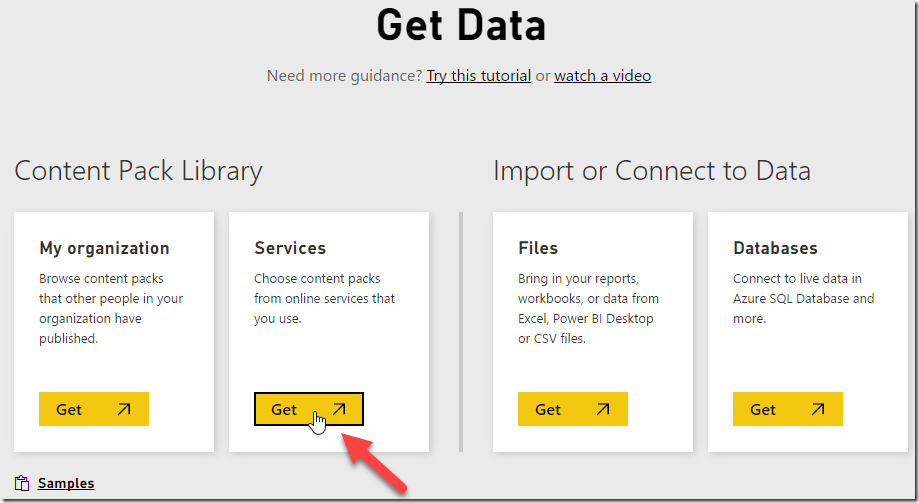
Click that, and you’ll be taken to another screen that looks like this:
Click Get on the Services tab.
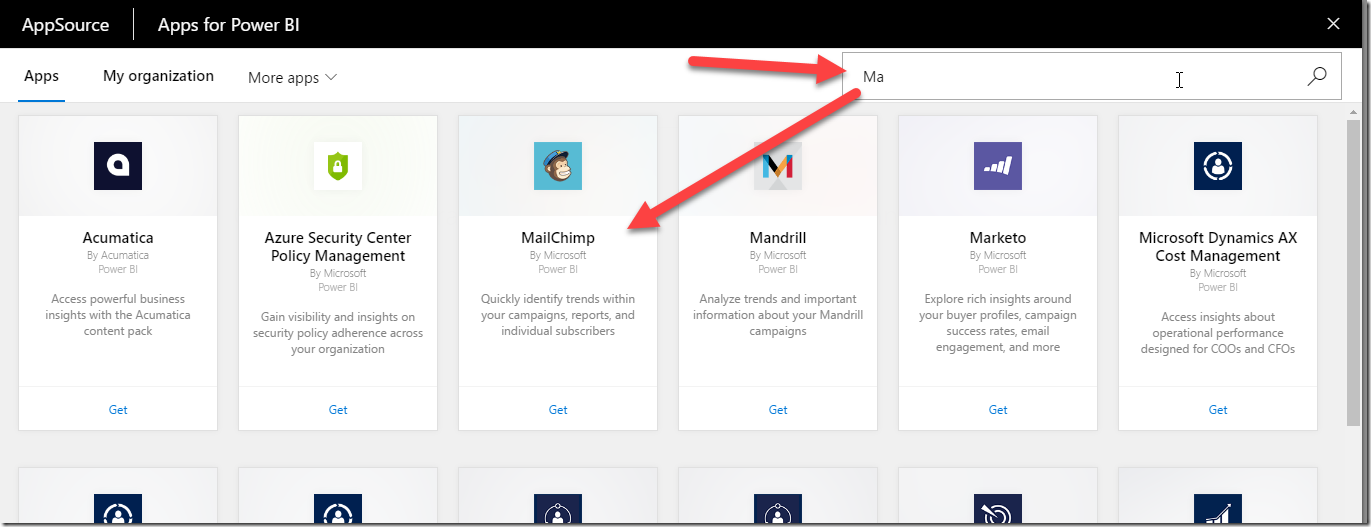
Now, to be fair this is still pretty new, so there’s a lot of sources that you would “hope” would be here (like Survey Monkey) which currently aren’t. Despite this, the easiest way to find what you’re looking for is to start typing the name of the SAS source in the search pane in the top right. It auto-filters the app list live. Shown below is the results of “Ma” today:
So click the Get button at the bottom of the MailChimp.
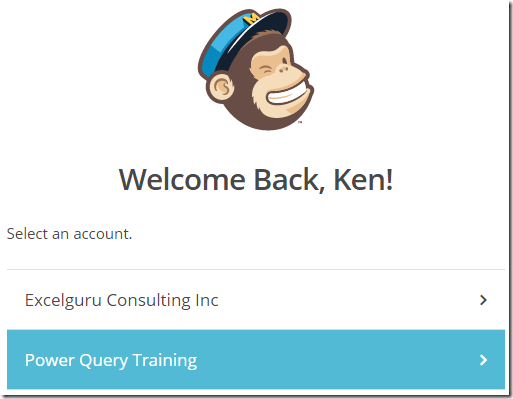
You’ll now be asked to sign in. If you have multiple domains under your MailChimp profile, just select one for now. What you’ll see is that it takes you back to the portal and lets you know that it’s loading your data.
Step 2: Wait
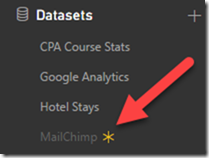
Seriously? Yes. When you’ve chosen the account to log in, you’ll see that you get a new entry in the Dataset, Report and Dashboard sections of the Power BI portal:
See how the source is greyed out and has a star? The star means it’s a new item, but the greyed out status means it’s loading. It takes a while, and you won’t be able to do anything with it until it’s finished the initial load. So go get a coffee and wait for the chimp to finish it’s trek to your portal.
Step 3: Explore the Dashboard
Wait, what? I don’t need to build the dashboard myself?
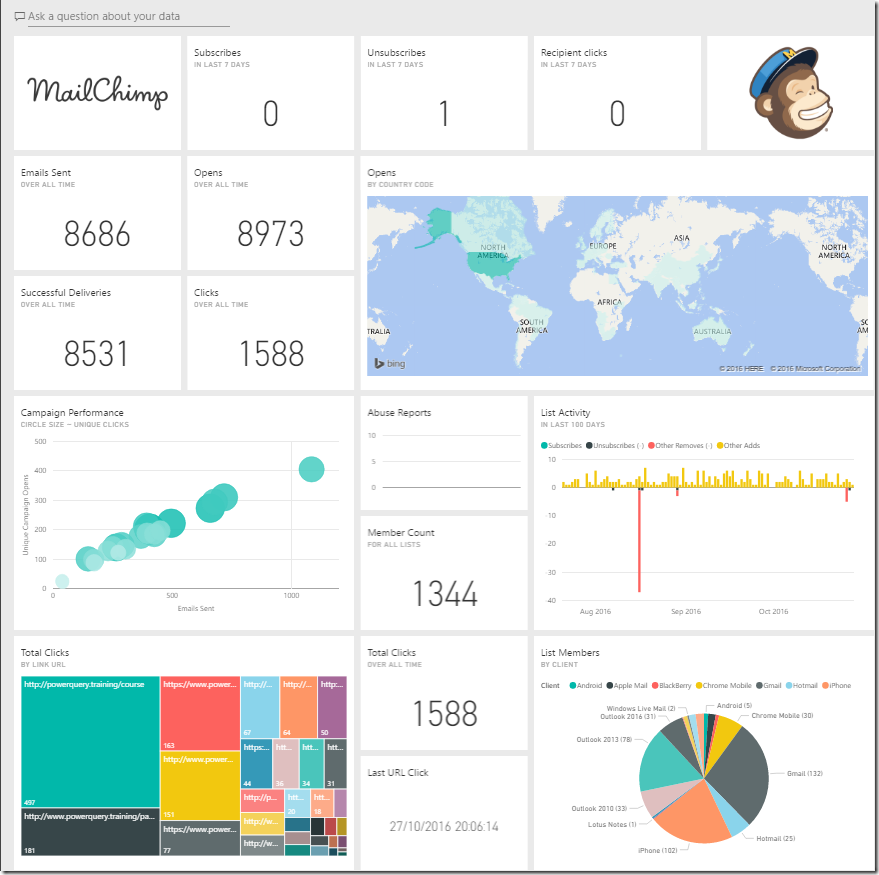
No! It’s already built for you. MailChimp and Power BI together in a few easy clicks. Check it out!
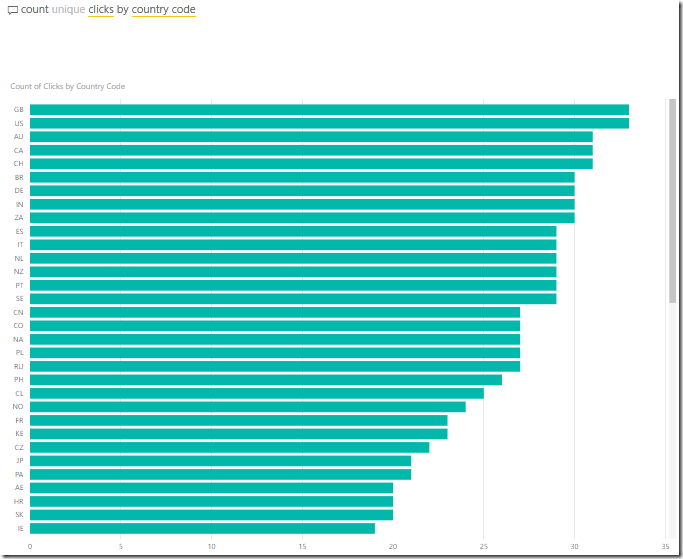
All fully clickable, and Q&A works like a charm:
What about Scheduled Refresh?
Right, I hear you. That data set took a long time to load, so you don’t really want to have to come in and refresh it every day. (I mean, unless you need an excuse to go for coffee…)
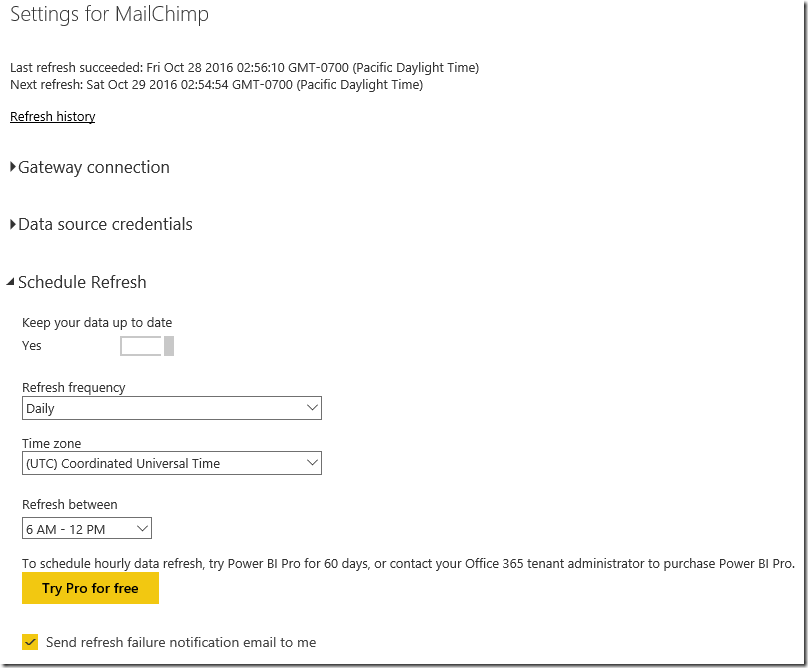
Well check this out. This is shot from an account which only has a Power BI Free subscription. I access this by clicking the … next to the data set then choosing Schedule Refresh (normally a Power BI Pro feature only):
Oh… and did I mention that this was created on Oct 27? This report has already refreshed, and is scheduled to do it again with no configuration or pro license needed. Ah the beauty of connecting to a pre-built SAS dashboard!
What about my other MailChimp Accounts?
If you have more than one domain in your MailChimp account, you might be surprised to see that when you try to add another MailChimp dashboard it just creates the same one again without prompting you to log in. This is because it uses the cached credentials. So how do you make this work?
Basically, you create the same report again then, once it’s finished loading, you go and edit the data source credentials on the Dataset for the second report.
To do this:
- Go to Datasets –> Ellipses –> Schedule Refresh
- Expand Data source credentials
- Click Edit credentials
- When prompted for oAuth2 credentials, click Sign In
- Insert the username & password
- Then choose the new data set when prompted
I’d also recommend going to each of the datasets, reports and dashboards and renaming them using the ellipses as well, just to keep it clear which is which.
Final Thoughts
The one thing I can’t do here is download the pbix file that was used to create this dashboard. I’m sure it’s heavily parameterized (how else would they deploy for whomever adds it), but I’d sure love to do that. Why? So I could connect directly to MailChimp easily from PowerBI Desktop or Excel… maybe so that I could merge other data in with it. (Once it’s published, I cannot get in and examine or change the M code in any way.)
Having said that, this is still pretty darned cool stuff! I really hope other vendors jump on this train as well. Building dashboards can be hard, and this just makes it super easy. I’d love to see one for my Facebook account, LinkedIn and other SAS sources.
For reference, Google DOES provide a dashboard too, and it’s just as easy to set up and auto refreshes like this too.



One thought on “MailChimp and Power BI”
One of the key advantages of the MailChimp PowerBI connector is that it is quite easy to setup cross-list-reports, which isn't possible in the MailChimp interface.