One of the most important questions we have when publishing our data models and Power BI reports is Can users see my raw data? The answer to this should virtually always be no unless you’ve explicitly stated you want this to be the case. In this post we’re going to look at this problem and show you why this is a really serious question.
What kicked off this post?
At last week’s Power BI meetup in Vancouver, Peter Myers was demoing the feature to create a public facing web page (as I showed in this post.) He quickly took his raw data, threw together a few visuals (without writing a single custom measure) and published the page to the web. All in all it took less than 3 minutes for him to do this.
And naturally as he demoed to everyone that they could indeed get to the dashboard and play with it, the question of “Can users see my raw data” came up. I confidently said no, and then it happened…. someone pointed out they could drill in to all the records that made up the data point.
It was a mic drop moment as that completely violated what we were expecting. Part of the whole mantra of Power BI that we’ve been celebrating is that users only see what you want, and can’t get back to the raw data.
The “See Records” Feature in Power BI
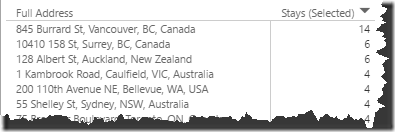
Sure enough, this person was able to right click a chart and say “See Records”. So what does that do? It pulls up the full details of each transaction line that led to the data point:
Even though it doesn’t pull the records for the entire data set, it was still pretty horrifying. With enough time, a reader could drill in and discover things about the underlying data that had never been intended to be revealed.
EDIT: It's 2 days after the initial post date, and something has already changed here. While See Records still shows the raw record set, it now only shows the columns that contribute to the chart, not the extra columns. There could still be an issue, but it's not as bad as it used to be.
EDIT2: After a bit more diving in here, I discovered that it was me that changed something by hiding some of the model columns in Power BI desktop. Hiding columns in the underlying table prevents them from appearing, but you still see all raw data points.
If you want to try this yourself, you can do so on the public version of the report I used for this post, which you can find right here.
The “See Data” Feature in Power BI
Seeing this, I immediately jumped over to the Hotel Stays report that I had published and checked my visuals. Oddly, none of my visuals had the See Records feature. They did however, have a feature called “See Data” which concerned me a bit at first. But once you dig into it you’ll find it yields results like the following:
So basically it’s just a table view of the data that is already shown in my chart anyway. It doesn’t expose anything new. To be completely honest, it doesn’t add a ton of value as you don’t seem to be able to copy the table from the page or anything. So the good news here is that no confidential data is being exposed.
Can “See Data” accidentally expose confidential data?
There is one case that I’ve found where the See Data function could actually expose confidential data, and that is when using map visuals. On my Nights Away From Home report I used a map visual to plot the data points. If you right click any of those data points and choose See Data, it gives you a list of all the data points.
Because I used a full street address to plot these on the map, I get a full list of detailed addresses. So if privacy is a big concern here I’d suggest you plot your data points using a postal code or city. Something with less granularity. In my case I’m not totally concerned as these are all public hotels.. except for my friends locations where I had already adjusted the addresses to preserve their privacy by their request.
The Big Question: Can users see my raw data in Power BI?
So the simple answer would appear to be “Yes” they can. But it’s actually a bit more complicated than this. The Show Data feature is not – in my opinion – a data security risk. The data is already shown in a visual, it’s just a different way of stating it. So the real issue is around that Show Records option.
There are actually two big questions here…
- Can I disable the Show Records option?
- Why did my dashboard NOT have the Show Records option where Peter’s did?
As you can see, the second question actually answers the first. It IS possible to disable the Show Records feature, but how? As Peter and I were scratching our heads on this I decided that I needed to find out.
Controlling the ability to see my raw data in Power BI
As it turns out, the secret comes down to two things:
- The type of visual you choose
- The type of measure you create
I should also point out that the See Records and See Data features can be triggered from within Power BI Desktop. This is fantastic as it means that you don’t need to publish to web to test your dashboard. (Yay!)
The Data Set
To demo these features and issues, I’m going to use a subset of the data I had for my Nights Away From Home report:
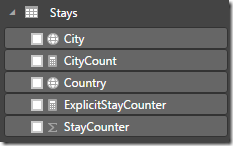
To quickly explain this, I have three data columns in the table: City, Country and StayCounter. The first two are obviously text columns, and the last is a numeric column where each row contains the value of 1.
The last two items are DAX measures defined as follows:
- CityCount = COUNTA(Stays[City])
- ExplicitStayCounter = SUM(Stays[StayCounter])
Can users see my raw data in Power BI if I use a Card Visual?
To answer this, I created two card visuals. The first was created using an Implicit measure. I.e. I dragged the text based City field onto a card and let Power BI create an implicit “Count of City” measure:
The good news here is that there is no right click context menu for a Card. (Give it a try!)
So using a Card visual means that your audience can never drill in to the underlying data. I’m happy with that part.
Can users see my raw data in Power BI if I use a Bar Chart Visual?
Once again, I created two visuals here:
| Field | Red Visual (on left) | Green Visual (on right) |
| Axis | Country | Country |
| Value | City | CityCount |
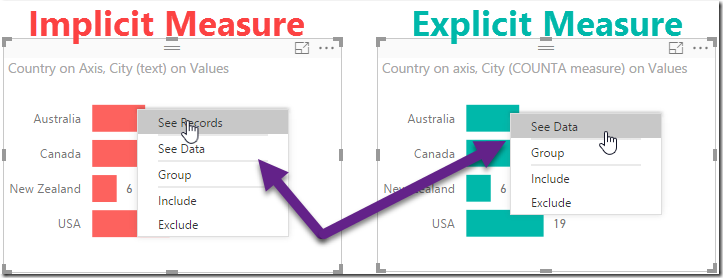
In the case of the green visual, I have explicitly created my own measure by writing DAX. In the case of the red visual, I have an implicit measure where Power BI has done the measure creation for me. (Interestingly it reports the measure as Count of City which is not technically correct… it is actually a COUNTA of City, as Count can only count numeric values, where City is a text based field.)
Semantics aside, have a look at what you see for options:
This was a bit shocking to me… so Power BI defaults to allowing you to drill into the underlying records… at least for implicitly generated measures that count text based entries.
Can users see my raw data in Power BI if I use an implicit SUM measure?
So the next question I had to explore is if this issue where users can see my raw data limited to only implicit measures based on text fields? If the field was numeric and I use an implicitly created measure to count or sum it, will I have the same issue where the underlying records can be exposed? Let’s take a look:
To avoid confusion here, I created to new visuals, but column charts this time. Here’s how they were configured:
| Field | Red Visual (on left) | Green Visual (on right) |
| Axis | Country | Country |
| Value | StayCounter | ExplicitStayCounter |
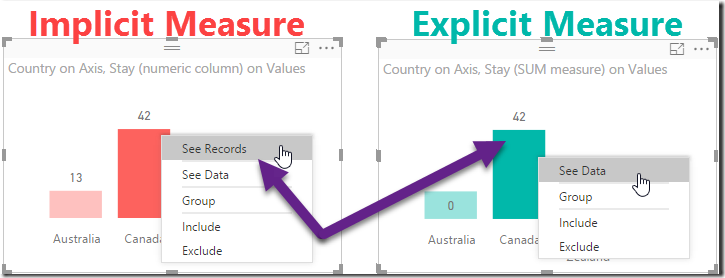
The key difference here is that I just dragged the raw StayCounter column on to the red visual and let Power BI implicitly create the SUM measure for me. In the case of the green visual, I wrote the DAX to say exactly what I wanted. The two measures are mathematically equivalent which was important for an apples to apples comparison. And here are the results:
(Yes, they look almost identical to the previous version, but if you check the titles – or play with the public version of the report - you’ll see that they indeed use different configurations.)
Observations and Thoughts
As you can see, the results are consistent with implicit versus explicit measures. So if you want control of whether your audience can drill in to your underlying data records, you need to know this:
| Measure | Implicit – Power BI | Explicit - DAX |
| Exposes “See Records” | Yes | No |
| Exposes “See Data” | Yes | Yes |
This is a design issue
In my opinion, this is not good. This basically means that the “quick and easy” way to create a report sets up to potentially expose data that should not be exposed. And it’s not only applicable to reports that are shared publicly, it’s applicable to all reports distributed via Power BI Desktop, organizational level sharing and external sharing. My feeling is that the Show Records feature should be disabled by default, and there should be a flag that you need to enable in order to enable this feature.
Having said this, the Power BI team has a problem. I’d say that the vast majority of their audience do NOT want the See Records feature enabled by default, but some people rely on it. This is one of the pain points of having something out there in the wilds, then realizing that something isn’t working the way you want. To fix this, they’d need to released the a method to configured the visibility of the Show Records feature (probably to Power BI Desktop) then switch the default on Power BI. Someone will no doubt complain of a loss of the feature, but as long as there is a way to fix it I’d say the risk of upsetting a customer in this manner outweighs the risk to Microsoft's entire customer base of accidentally exposing company confidential information.
My personal feeling is that I’d like to see both the See Records and See Data features configurable by the report author. I’d like to see both off by default, with the ability to turn them on as needed.
In the mean time…
While current implementation is ultimately not what I think should happen, I’m actually happy it is consistent. Why?
As it turns out, the reason I never saw this is that I’m in the practice of taking explicit control of my data and measures. Since my earliest days of working with Power Pivot in Excel, I have never relied on the implicit measures, electing to always write my own using DAX. This is true even for simple measures like SUM(Stays[StayCounter]).
Part of my reason for this is just habit, part is because I want to learn, part is because I don’t trust some of the implicit stuff that happens and don’t trust defaults. In VBA we have a specific command to force variable declarations which is called “Option Explicit”. I’ve always adopted that as not just a code word, but rather as a development standard. In this case I’m fortunate that it saved my data.
If you don’t know DAX, you should learn it. Not for this reason alone, but it is certainly another reason.


10 thoughts on “Can users see my raw data in Power BI?”
Wow... great findings... Did you reported it to PowerBI team?
At the summit this week, and do intend to.
Hi, my opinion is different. Most BI tools actually allows you to drill to row level data and it was one of the most wanted Power BI features. Users want to inspect data and use it for operational purposes. It would be nice to have control over it. Even more, one of the biggest downsides of pbi is that as soon as you create dax measure you loose 'see records' option. Huge limitation. Would be nice if you could mention to MS to enable this plus add disable / enable feature. People in my company use that feature all the time! Yhanks
Hey Daniel,
I agree that the ability should be able to be toggled on both explicit and implicit measures. I'd still rather that it was disabled by default to save me from accidentally exposing data that I shouldn't.
Ken, what about Analyse in Excel? This seems to be a problem too. I have a client that is quite unhappy that Analyse in Excel is a tennent level toggle on/off instead of a report level setting. I know this is not available in public sharing, but it can be an issue if you have a private tennent where you are sharing reports with third parties (e.g. Vendors, suppliers etc)
Great point Matt. Not nearly as protected as we might want here... 🙁
Thank you very much, I'd been scratching my head about the See Records and when it showed for quite a while. I concur that having an option to enable/disable would be great, my preference is actually that it's available. A lot of our internal reporting is about exception management, and we need people to drill down to the specific exceptions. Right now I'm getting around that by setting up a tab of the report with a table of all the data, but that's not a great solution.
That said, I'm wondering if the root issue is that when you have an implicit measure, it's pretty easy for the system to determine what data you want to see, where if you have any explicit measures it's not. That's related to a common problem I have in Excel PowerPivot where I do most of my calculations as measures, and then when users want to drill down into the data, they can't see those calculations at the individual level they need. I end up doing a lot more calculated columns or Power Query calculations just to display what I need to the end user, with all the performance impacts that implies.
Hi. Thanks for the post. Having a toggle at the report level for this setting would get my vote. The 'see records/data' would be a useful option if using DAX too. I'm also adding an extra table to reports to show relevant tables to users.
Presumably this isn't an issue if you have the Pro version and opt for row level security, as only users will access to those rows would see the records?
Hi Kent,
Depends on your interpretation. You would be limiting users to only see records that make up the visuals they have access too. But consider a financiak report where the manager wants to share the overall position of the company but doesn't want the user to drill in to payroll detail. The data still needs to be in the row level security to be seen, so the user would be able to get at it.
(To be fair, maybe you could pre-aggregate this data to compress the detail, but hopefully this shows the potential concern.)
If you use the Analyse in Excel feature drill-through is also working for Explicit measures.
It appears to me that the columns Excel shows is the column in the table where the measure is created that does not have a relationship to another table.