After one of my previous sorting posts, Devin asked if we can number rows by group. Actually, that's a paraphrase… what he really asked was:
Any thoughts on how to produce something like a ROW_NUMBER function with PARTITION from T-SQL? Similar to this: https://docs.microsoft.com/en-us/sql/t-sql/functions/row-number-transact-sql?view=sql-server-2017#d-using-rownumber-with-partition
I've never used the PARTITION function in SQL, so I checked in with him just to confirm what he was after. And here it is: take the first three columns of the table below, and add a final column with index numbers sorted by and restarting with each group:
And of course there is. For this one, though, we actually do need to write a little code.
Preparing to Number rows by Group
Now here's the interesting part. The source data looks exactly the same as what you see above, the only difference being that in the output we also added a number rows by group. So how?
Well, we start by grouping the data. Assuming we start by pulling in a table like the above with only the first 3 columns:
- Sort the data based on the Sales column (in descending order)
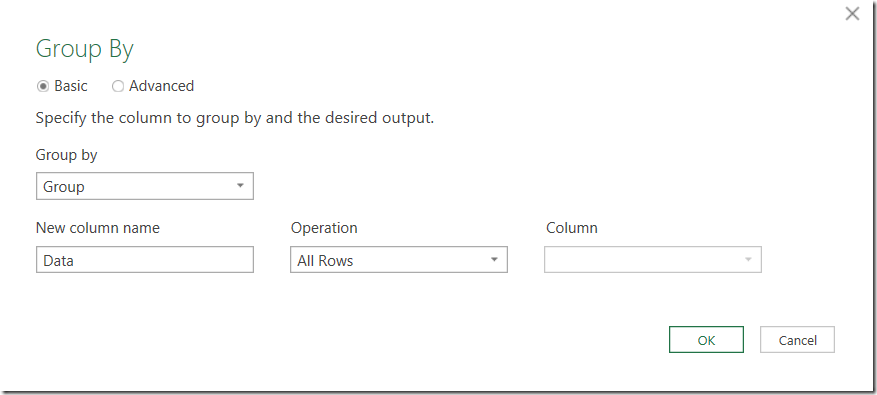
- Group the data by Group
- Add a aggregation column for "All Rows"
Like this:
Which yields this:
We are now ready to add the numbering.
Now to Number rows by Group
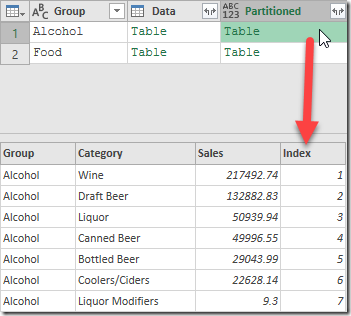
In order to number rows by group, what we really want to do is add an Index column, but we need to add it for each of the individual tables in our grouped segments. If we try to add it here, we'll get 2 new values, showing 1 for Alcohol and 2 for Food. That's not exactly what we need. But if we expand the column, then the index will not reset when it hits Food, and the numbering won't be right either.
The secret here is to add an Index column to each of the individual tables in the Data column, then expand the columns. The numbering will then be correct.
To do this, I added a custom column using the following code:
=Table.AddIndexColumn([Data], "Index", 1, 1)
Where did I get this code? I actually added an Index column to the whole table. That added the following code in the formula bar:
=Table.AddIndexColumn(#"Grouped Rows", "Index", 1, 1)
I copied that code, and deleted the step. Then I added my custom column, pasted the code, and replaced #"Grouped Rows" (the name of the previous step) with the column I wanted to use.
The result was this:
The final steps to clean this up:
- Remove the Data column
- Expand all columns from the Partitioned table except the Group (since we already have it)
Which leaves us with our table in place including the new column which does number rows by Group as originally planned.
If you want to play with this one, the example file can be found here.
I would also be remiss if I didn't mention that we have a great video in our Power Query Academy that covers this kind of operation (among others). It's called "Advanced Row Context" (in our M deep dive section) where Miguel shows all kinds of cool stuff that you can do by adding new columns to Grouped Rows.


37 thoughts on “Number Rows by Group Using Power Query”
Holy cow! That's really amazing, going into my quick reference list for sure!
Good stuff, Ken. I was using your solution and trying to build a custom function with it, but I often struggle with getting the right structure for them. Any wisdom there?
Maybe that should be the next blog challenge, Alex. 😉
Curious, how do you see the function working? Pass it a table and tell it which master column you need to group by? How would you control the sub-sorting... make the user do that first, or as part of the function? (The more you want the function to do, the more parameters and checks that will need to be inside it, and the more complicated it becomes.)
@Matthew, the interesting part about this one to me is that I've never been asked this until Devin raised it. Within 7 days I was then asked 3 more times by completely different people!
@Ken, I'll add to the weirdness, literally last week I had a scenario where this would have been extremely helpful, but it was so far beyond what I'd thought of that it never even occurred to me to look for something on it.
This week, I got another request for a completely different analysis where this is probably going to be crucial.
Man, I love Power Query. DAX is cool too, but PQ makes me happy.
Ken, love this. Was just having a water cooler discussion with P3 folks around easy way to get grouped numbers. Thanks!
Thanks Reid!
@ Ken you can add the custom column in line
let
Source = Excel.CurrentWorkbook(){[Name="Data"]}[Content],
mSort = Table.Sort(Source,{{"Group", Order.Ascending}, {"Sales", Order.Descending}}),
mGroup = Table.Group(mSort, {"Group"}, {{"GRP", each Table.AddIndexColumn(_, "Index", 1, 1), type table}}),
mRemCols = Table.RemoveColumns(mGroup,{"Group"}),
mXpandGrp = Table.ExpandTableColumn(mRemCols, "GRP", {"Group", "Category", "Sales", "Index"}, {"Group", "Category", "Sales", "Index"})
in
mXpandGrp
I have been using the following for this - I call it a "clustered index". The english from the code is not great, but the code works fantastically. The below code needs to be added into a blank query in the advanced editor:
let
Suoyin = (table as table, text as text) as table =>
let AddedSortIndex = Table.AddIndexColumn(table, text, 1, 1),
RemovedColumns = Table.ReorderColumns(AddedSortIndex,List.Combine({{text},List.RemoveLastN(Table.ColumnNames(AddedSortIndex))}))
in RemovedColumns,
Clsuoyin = (table as table, list as list, text as text) as table =>
let AddedSortIndex = Table.AddIndexColumn(table, "Orindex", 1, 1),
GroupedRows = Table.Group(AddedSortIndex, list, {"FilteredTable", each Suoyin(_,text)}),
Colnames = List.Combine({{text},Table.ColumnNames(AddedSortIndex)}),
ExpandedTable = Table.ExpandTableColumn(Table.SelectColumns(GroupedRows,"FilteredTable"),"FilteredTable",Colnames,Colnames),
SortRemove = Table.RemoveColumns(Table.Sort(ExpandedTable,{"Orindex", text}),{"Orindex"})
in SortRemove
in
Clsuoyin
Then add the below line to your query:
let
Source = Excel.CurrentWorkbook(){[Name="ClusteredIndex"]}[Content],
addsuoyin = Clsuoyin(Source, {"Name","Factory"}, "Index")
in
addsuoyin
taken from:
https://social.technet.microsoft.com/Forums/sharepoint/ar-SA/d9a30cd0-9dbe-48ca-8260-8fabc585bceb/power-query-insert-index-by-subcategory-ie-clustered-index?forum=powerquery
Hi, Ken - I just wanted to take a moment and tell you that this solution was AMAZINGLY simple and I just used it last night on a project to great success. For those wondering how this might be used, here was my situation:
I had a list of contacts on one spreadsheet and a list of accounts on another, with both tabs having an account number column to tie them together. The order that the contacts were listed was based on their importance in the account. The higher the importance, the higher they were on the list. But of course, there wasn't any field that specified that and not all the contacts were grouped together by account number either. 🙁 Just the order from someone's head and placed on the page. I needed to know the top X contacts for each account. So I added an Index labeled Original Order to the query first so I would be able to recreate the order they arrived in and then sorted by Acct No and Original order, Grouped by Acct No and used your method to partition it and voila! All I had to do was filter for my <= X on my partitioned Index and done 🙂
On a side note, I tried just editing the formula from #"Grouped Rows" to [Data] and it complained. Big time. Not sure why deleting it and adding it through the Custom Function UI works, but not editing it directly in the formula bar *shrug*, but thought I would share that for others who might try to shortcut that "delete and then do this" step in your instructions.
Thanks again, I reference your blog articles all the time AND I made the office buy me a copy of M is for (Data) Monkey 🙂
Amazing. Used a similar approach but not as simple as this before. Thanks.
Thanks so much! I've been wracking my brain for a few days on how to get this to work. Also, thank you for telling us how you got to the solution.
I've been trying to section out the last 10 comments on each account to show a quick history without having a huge comment cell that usually cuts itself off due to restrictions. Talk about a holiday miracle!! That's you buddy!!!
Pingback: Dynamic Column Merging in Power Query – Feathers Analytics
Outstanding! I found this for a project I needed to complete this week...and got asked to do another very similar project by another customer for this week. Thanks, Ken.
Very Clever Ken, thank you, just what I needed.
Hi,
Thanks the solution it's absolutely brilliant!
I ran into an issue..when i run the function it takes about 10 Min. to refresh the data (when it usually takes 30 sec.)
Any thoughts?
Hi David, what data source are you pulling from, and are there any other merges or anything happening prior to the grouping? How big is the data set overall? We'd need to know a lot more about your setup to debug this one...
Hi David, what data source are you pulling from, and are there any other merges or anything happening prior to the grouping? How big is the data set overall? We'd need to know a lot more about your setup to debug this one...
Hi,
1.Data source is SQL server.
2. I have a multiple steps prior to the one discussed here (it'll be easier if i can send you the code, where to?)
3. Data is not that big, about 10K rows.
Hi David, can you post it in our forums at https://www.excelguru.ca/forums ?
Wow! This is awesome. You are the greatest data cruncher. Has really help me save a lot of time.
Thnaks very much
Pingback: Data Color Reference for Power BI Themes (as of December 2019) - DataVeld
Gracias por la explicación, me ayudo mucho!
Thank you!! amazing tip 🙂
Thank you so much. I use this type of partitioned ranking often (SQL and with regular nested Excel fuctions) and I could not figure out how to do it with Power Query.
This is amazing, and one of the most simple and elegant solution I have ever come across. Thanks a lot. This has helped me immensly.
Incredible solution! Thank you!
Hi, thanks for sharing this beautiful code. What if you have two categories
ID Status
A In Progress
A In Progress
A In Progress
A Completed
A In Progress
B Completed
C In Progress
D In Progress
E In Progress
F Completed
What I Require is
ID Status No
A In Progress 1
A In Progress 2
A In Progress 3
A Completed 4
A In Progress 1
B Completed 1
C In Progress 1
D In Progress 1
E In Progress 1
F In Progress 1
F Completed 2
Please can you help
Hi Michael, I think that this would be better to ask in our help forum at https://www.excelguru.ca/forums.
Thank you! You have help me a lot
Wow, this is amazing. And simple.
Simply amazing.
This is the best I've found from all the different solutions. Thank you so much!
For some reason the sort doesn't keep when I try this. I sort 1 column ascending and 1 descending (just like you have done) but once the group by happens the data is no longer sorted behind it so therefore the indexing isn't applied properly. Any thoughts?
Hey Justin, if that happens, you could try adding an index column immediately after your sorting and before the grouping. That tends to buffer the results so that the sort gets preserved in the grouping.
Extremely useful!
ThankYou a lot a lot a lot ...
I love it!
@Ken thankyou for the intra sorting, it works!
Just want to add my thanks as well. Saved me a bunch of if/elses
Awesome, dude!