This morning I logged in to check the solutions for Power Query Challenge 6 that were submitted and... Wow! There were a bunch, and some cool variety there. So now it's time to show you all what I came up with here.
What was Power Query Challenge 6?
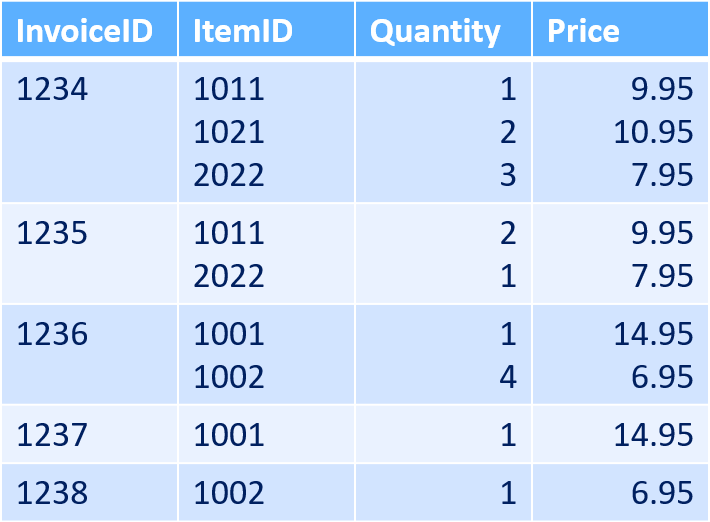
The full description and source data can be found in yesterday's post, but in short it was to convert this:
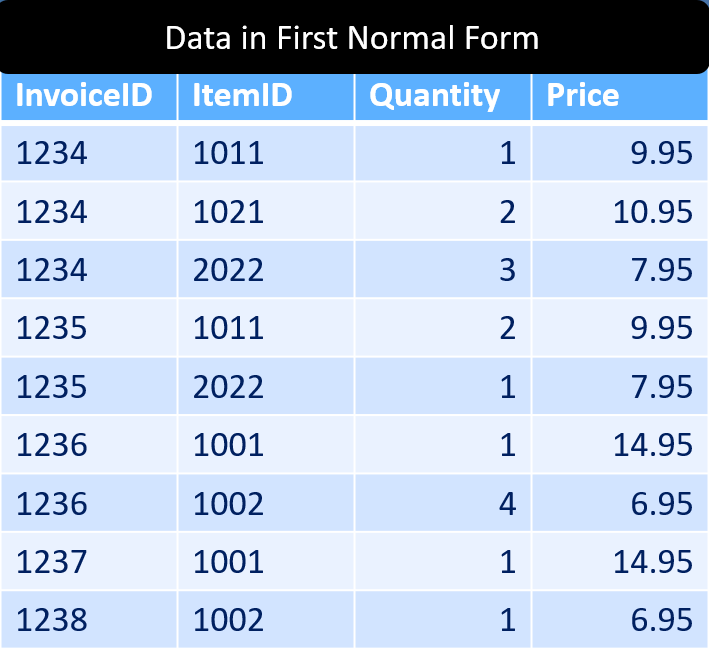
To this:
So how do we do it?
Two Solutions for Power Query Challenge 6
Wait, two solutions? Why?
As it turns out, I put together two for this one. My first attempt was cooked up to solve the issue on short notice. Then I built another that seems a bit more elegant. So I'll show them both, although quickly.
Solution 1 - Splitting Individual Columns and Merging Back Together
The first of my solutions for Power Query Challenge 6 is actually quite similar to what Ali posted in the solution thread. It basically follows this method:
- Step 1:
- Create a Data query that connects to the source data, and load it as connection only
- Step 2:
- Create 3 new queries for ItemID, Quantity and Price which
- Reference the data query
- Keep the InvoiceID column and the other relevant column
- Split the relevant column by delimiter, ensuring it splits to rows (not columns as it defaults to)
- Add an Index column
- Create 3 new queries for ItemID, Quantity and Price which
- Step 3:
- Reference one of the Step 2 tables, and merge the other two tables to it, based on matching the Index column in each
So when complete the query chain looks like this:
And returns the table we're after:
The only real trick to this one is that - when you are building the Price query - the Price column will pick the decimal as the delimiter, so you have to force it to a line feed. So building the Price query would go through the following steps:
- Right click the Data query --> Reference
- Select the InvoiceID and Price columns --> Right click --> Remove Other Columns
- Right click the Price column --> Split column --> By Delimiter
- Clear the decimal from the Custom area
- Click the arrow to open the Advanced area
- Change the selection to split to Rows
- Check "Split using special characters"
- Choose to insert a Line Feed character
- Click OK
- Set the Data Types
- Go to Add Column --> Add Index Columns
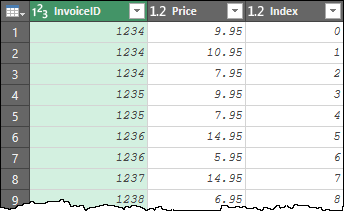
Resulting in this:
The ItemID and Quantity queries follow the same steps, except that Power Query now correctly identifies the Line Feed as the character to split on.
Solution 2 - Group and Split
While the first solution to Power Query Challenge 6 worked, it left me less than satisfied as it took a bunch of queries. While effective, it didn't feel elegant. So I cooked up another solution that uses Grouping. It's actually quite similar to the first solution that Bill Szysz posted.
The basic method is as follows:
- Connect to the data
- Right click the InvoiceID column --> UnPivot Other Columns
- Right click the Value column --> Split Column --> By Delimiter --> OK
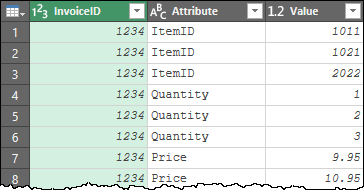
Following the steps above gets us to this state:
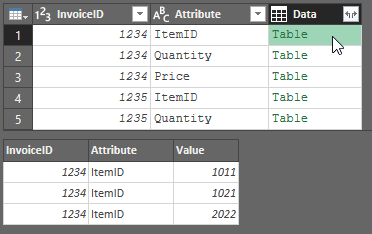
To unwind this, we group it:
- Go to Transform --> Group By
- Group By InvoiceID, Attribute
- Aggregate a "Data" column using the All Rows operation
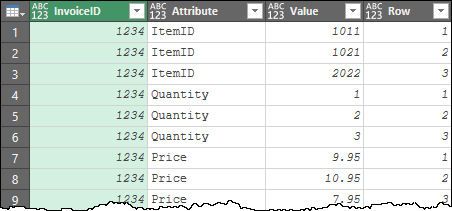
At this point, we need to number these rows, so I just busted out the pattern to do that from our Power Query Recipe cards (recipe 50.125).
- Go to Add Column --> Custom
- Column Name: Custom
- Formula: =Table.AddIndexColumn( [Data], "Row", 1, 1)
- Right click the Custom column --> Remove Other Columns
- Expand all fields from the Custom column
Leaving us with this data:
The next step is to Pivot it:
- Select the Attribute column --> Transform --> Pivot Column
- Choose Value for the Values
- Expand the Advanced arrow
- Change the Aggregation to "Don't Aggregate"
- Click OK
- Select the "Row" column and Remove it. (Yes, it was needed to unpivot this correctly, but now adds no value.)
- Set the data types
- Load it to the desired destination
At this point, the query (again) looks perfect:
Now, I must admit, this felt far more professional and left me feeling good about it.
Which Solution to Power Query Challenge 6 is Better?
Naturally, solution 2 is better. It takes less queries, and looks way cooler. Right? Not so fast...
The real question is in the performance. And for this one I thought I'd test it. But I needed more data. I expanded the set to 11,000 rows and then used a tool we're working on to time the refreshes. Privacy was left on, and all times shown are in seconds:
- Solution 1: 1.43, 1.48, 1.11, 1.27 Avg ~1.32 seconds
- Solution 2: 2.77, 2.65, 2.63, 2.68 Avg ~2.68 seconds
I'll be honest, this surprised me. So I went back and added the GroupKind.Local parameter into the Grouped Rows step, like this (as that often speeds things up):
Table.Group(#"Changed Type1", {"InvoiceID", "Attribute"}, {{"Data", each _, type table [InvoiceID=number, Attribute=text, Value=number]}}, GroupKind.Local)
The revised timing for Solution 2 now gave me this:
- Solution 2A: 2.54, 2.49, 2.56, 2.61. Avg ~2.55 seconds
So while the local grouping did have a small impact, the message became pretty clear here. Splitting this into smaller chunks was actually way more efficient than building a more elegant "all in one" solution!
My solution (including 5,000 rows of the data), can be found in the solution thread here.




4 thoughts on “Solutions for Power Query Challenge 6”
Hi Ken,
Interesting findings on solution 2. Thanks for sharing.
I've a video for solution 1 (not exactly the same, but 99%).
https://youtu.be/w9O-OfH_AIM
Hope you or your readers like it.
Cheers,
Is the fill up or fill down function in power query not easier.
Hi dirk,
It's not about filling up or down for the first column. There's no empty cells there to fill into. The issue arises from splitting the final three columns into separate data points, which is tricky.
Thank you for sharing the two solutions, I came naturally with the 1st one, tried a more elegant one but with no result. I guess my brain is still in vacation 🙂