If you’re on Office 365 and don’t have Excel’s new Rich Data Types, you should know that they’ll be coming to you soon. Giving us the ability to create both Stocks and Geographies, these are going to add some exciting new capabilities to Excel, particularly if we want to enrich our data. In this post, we'll quickly explore what Rich Data Types are, what they add, and how they are treated by Power Query.
What is a Rich Data Type?
Have a look at the following data:
The challenge with this data is that it is completely text based. What if we wanted to enrich this with more information like population, latitude or longitude? The answer is to convert it to Excel’s new Rich Data Type. To do this:
- Select the data
- Go to the Data tab -> Data Type -> Geography
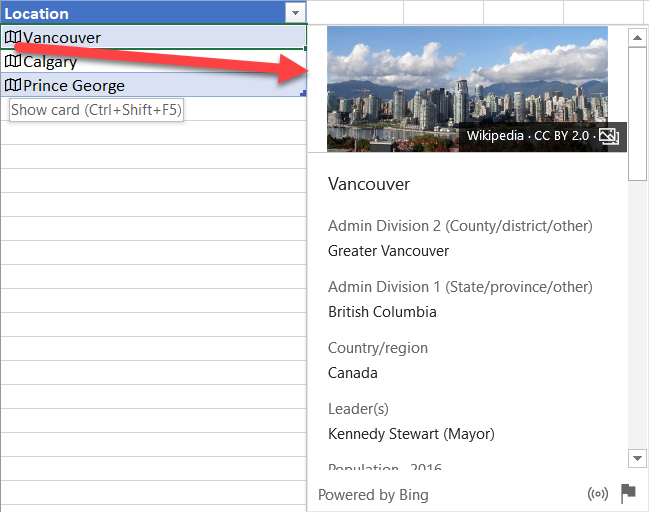
This will then convert the text into “Entities” with a little map icon beside them. And clicking on that little map icon shows some pretty cool new things:
This is the new geography data type. Unlike the original text entry, this object contains all of the properties you see on the card, adding a whole bunch of power to our original data.
NOTE: The data on this card comes from a variety of sources such as Wikipedia and WeatherTrends360. Full attribution can be found at the bottom of the card.
Working with a Rich Data Type
One of the very cool things about this new data type is the ability to expand the enriched data from the object. To do this:
- Mouse over the top right of the table
- Click the Add Column dialog
- Check the box(es) next to the columns you want to add
Shown below, we’ve extracted Latitude, Longitude, Population and Name.
Note: This button just writes the formulas needed to extract the data from the Rich Data Type. We could have easily written formulas to do this ourselves, such as =@Location].Latitude or =A4.Latitude.
The impacts of this should be pretty clear… even though we started with text, we now have the ability to convert it into a real place and pull further data back from that area!
Rich Data Types and Power Query
The ability to enrich a plain text data source is huge. One simple example of their impact is that we could add the Lat/Long coordinates to allow proper mapping in Power BI. But how will Power Query read these new Rich Data Types? Not well as it turns out…
Ideally, Power Query would pull in this data and recognize it as a proper record, which would allow you to extract the elements. And while I’m sure that will happen one day, it won’t be possible when Rich Data Types hit your build of Excel.
The trick to getting at this data today is actually already evident in the image above: create new columns in the original table. Even though Power Query (in Excel or Power BI) can’t read the Rich Data Type itself, it CAN read the columns you extract via formulas. It’s a workaround, and one we’d prefer not to have to do, but at least we can get to the enriched data that these new data types give us.


4 thoughts on “Using Rich Data Types in Power Query”
Ken, thanks for posting. Wondering if there's any underlying information about population data, i.e. "as of" or "2016 Census", etc.
genial! Ken muchas gracias.
Hi Danny,
It really depends on the data source what it can bring back. Some regions will report it, some won't. In the case of the data I used here, it shows on the card as "Population - 2016", but in the formula you can only pull back "Population" and not access the year. This makes sense to a degree, as referring to 2016 in a formula would break when updated to 2017. But it does leave us wanting the ability to get to that data source for more detail. What would be nice here is if we could say:
A4.Population.Source
Or something similar. I'll feed that back to the team.
Pingback: Do Data Types Matter in Power Query? - Excelguru