This is the fifth and final installment of this post series, and will demonstrate the process for publishing and sharing Power BI Dashboards (as compared to Reports.) Key things we’ll explore here are the additional benefits of Power BI Dashboards and how to share them without embedding them in a publicly accessible environment.
Series Table of Contents
This is a portion of a series of blog posts, which build on each other to create an overall solution from Data to a Power BI dashboard. You’ll want to follow along in order, so here’s the table of contents for the series:
- Get Data From OneDrive for Business
- Creating Power BI Visuals
- Creating Power BI Card Visuals
- Sharing Power BI Reports (for External Users)
- Sharing Power BI Dashboards (this post)
Public vs Private?
So as cool as the last post was, the begin question that comes up is how to share your report with specific people, not the entire world. The data could be confidential at some level, so this is a pretty big requirement to be able to solve.
The biggest piece of advice I would give is this area is DO NOT CREATE THE EMBED CODE as I showed in my last post. If you do, it’s accessible if anyone discovers the URL. We need to share in a totally different way.
Power BI Reports vs Power BI Dashboards
The secret here is that you can’t share Reports with internal users, you share Dashboards instead. But actually that’s okay, as it adds a couple of nice things to the report when you turn it into a proper dashboard. One is Q&A, and the other is that it stops showing the selection handles around the visuals every time you select them. ![]()
So how do you do it?
Creating a Power BI Dashboard
The answer is that you go back to your report and – up by that Refresh button that you’re never going to use – you click the “Pin Live Page” button. That takes you to this interface:
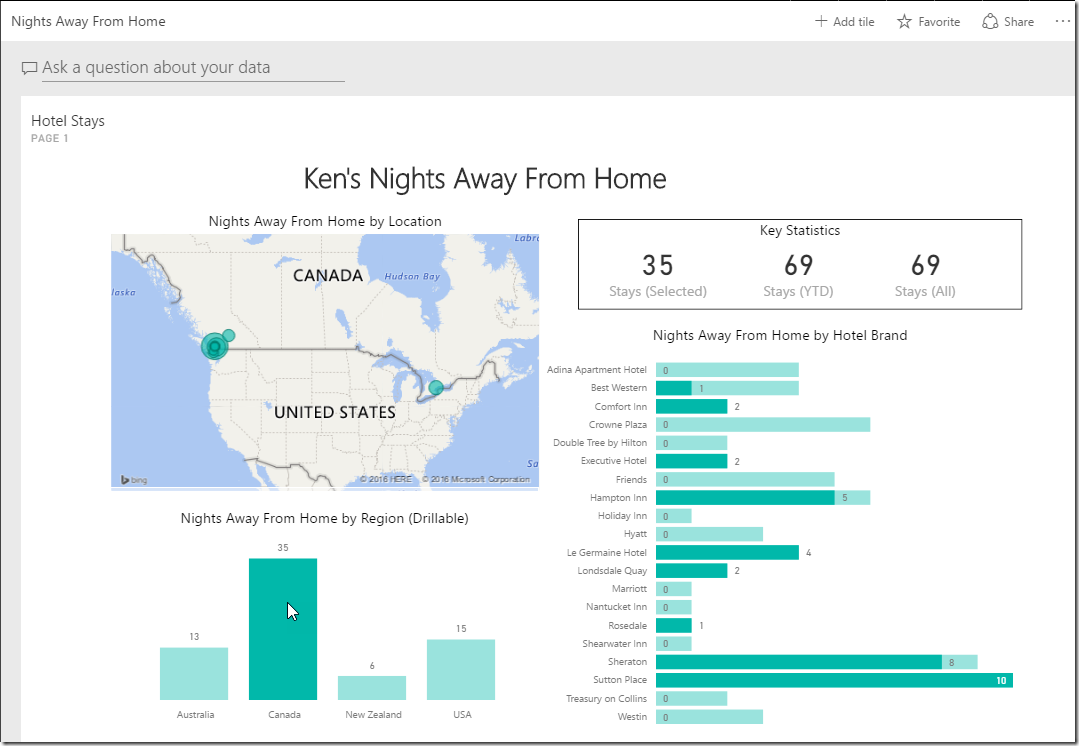
Notice that I have said I want to create a brand new Dashboard, and I’ve even given it a totally different name than the original report. Once I click the Pin Live button, it creates a new dashboard that shows up in the Dashboard area. And when you go there, you see this:
Notice that I’ve drilled in to Canada, and it still cross filters, but this time it doesn’t surround the chart with the little frame. Hmm… wait… that’s actually a problem, isn’t it? Back in the post where I showed how to create the column chart, I set it up to drill in, and now you can’t. The good news is that you can click in the upper left where is says “Hotel Stays Page 1” and it will take you directly to the report where you CAN drill in. (So these two things work together.)
So that is a note to keep back of mind. Dashboards are filterable at the top level, but if you want to drill in you need to go back to the underlying Report.
Q&A… aka as “HOLY CRAP THAT’S AWESOME!!!”
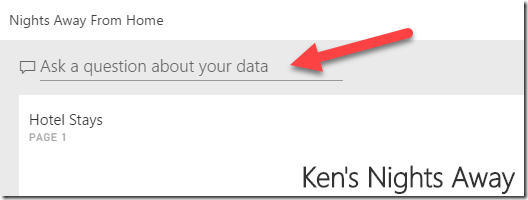
I’m not generally a big fan of noise and flashing lights in anything I encounter, but if there were one feature that should have them, this is it. Just above the visuals in the dashboard is a little area that says “Ask a question about your data”. It’s subtle, and you could easily use Power BI for ages without ever playing with this:
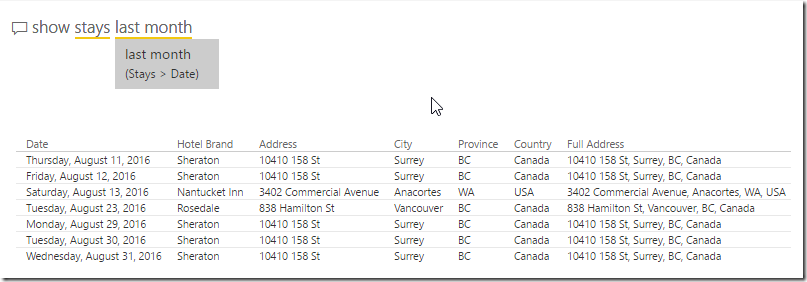
So what’s it good for? Natural language queries is what. Check out what happens when I just type in “shows stays last month”:
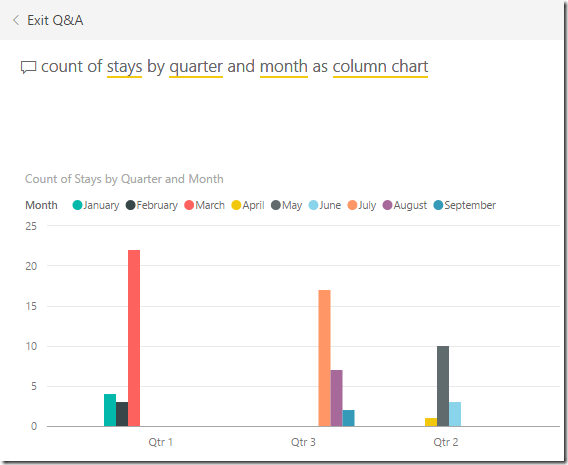
Woah… pretty cool. I never set up any calendar to do that, and it just lists the transaction listing for the previous month. Not impressed? How about this one:
I want to be really clear here… my data set does not have a field for Quarter. In fact, it doesn’t actually even have a field for Month.
You’ll also notice that I never once in this series of posts blogged about how to set up the data set to use this feature. That’s because I didn’t need to. It just works out of the box once you pin your report to a dashboard.
This is one of the coolest things in this product. Imagine pushing a data set like this to your boss and they can just query the data set to find out the questions they probably would have asked you. Nice. ![]() (Now, to be fair, really complicated questions are probably still going to need intervention, but still… pretty amazing.)
(Now, to be fair, really complicated questions are probably still going to need intervention, but still… pretty amazing.)
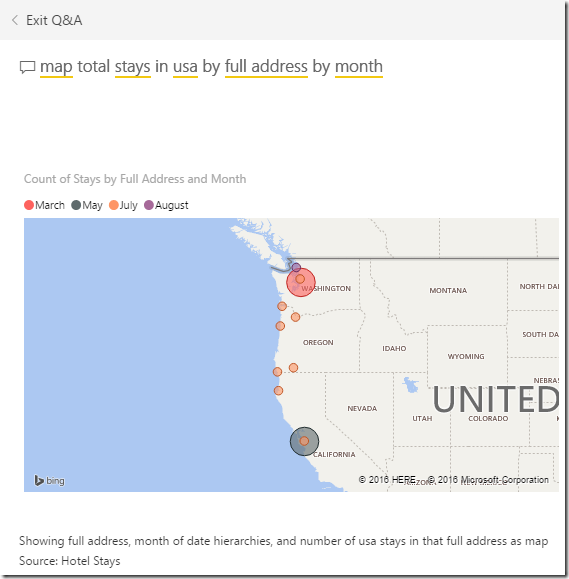
One more…
Oh, and I should also mention… once you find a really cool visual like this? There is a pin icon in the upper right that will let you just pin it to an existing or new dashboard.
As awesome as this is though… it’s actually not the topic of this blog post, it’s just a side benefit of what we need to do in order to set up our sharing. So with a bit of a tear in my eye, I’m going to click the Exit Q&A button and get back to it. ![]()
Sharing Power BI Dashboards Within the Company
When I refer to those “within the company”, I’m talking about users who are part of the same Office365 tenant. The best indication of this is that they have the same email domain as you do. But what I’m about to describe is equally true if the email domain is different, but the domain is registered under the same Office365 tenant.
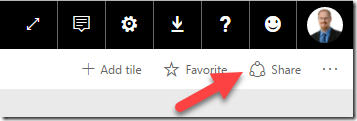
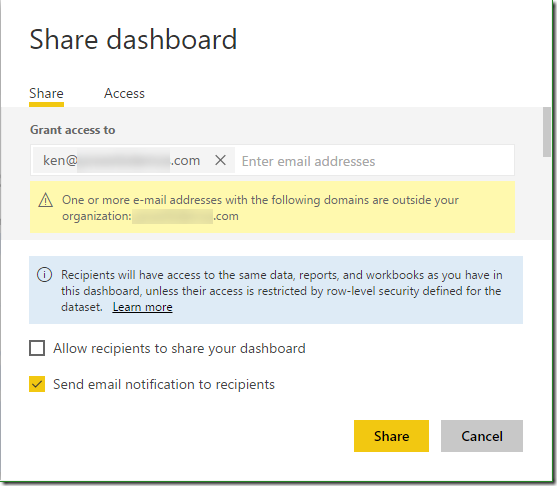
So to share a dashboard with someone in your company, you select the dashboard, then go to the top right corner of your screen and click the Share icon:
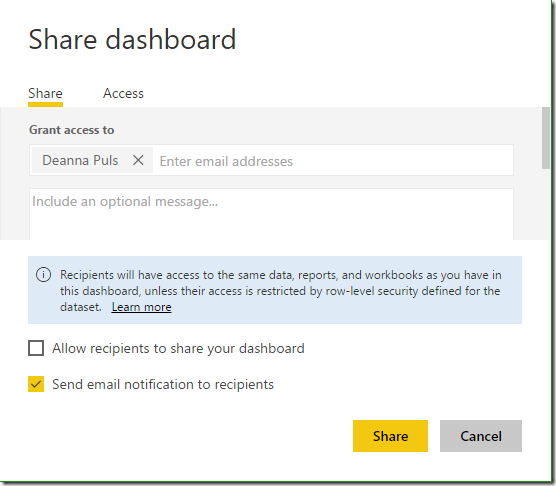
That will pop up a window where you can type in the email, and even an optional message. Since my email is all hosted in Office365, it is able to convert the email to a username for Deanna as shown below:
Notice also that I’m warned about her data access, and I can also disable her ability to share it with others. This is nice, as it allows us some kind of control over what our users can actually see and do with our data.
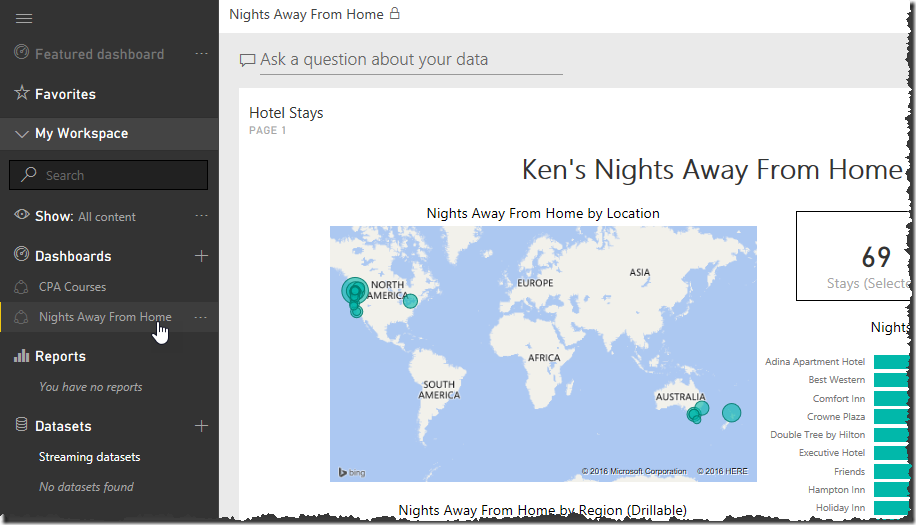
Once I click Share, Deanna gets and email notification in her inbox and, when she logs in to Power BI, she now has my dashboard listed in her Dashboards section:
Interestingly enough, I have been able to verify that with the Share option unchecked:
- She cannot share the dashboard with anyone else
- Changes made to the original dashboard update in the shared version
- The dashboard is listed in her Dashboards section for easy access
- All reports are drillable, and she can drill into the Report if she clicks the “Hotel Stays - Page 1” part near the top left of the dashboard. In fact, if she wants to drill in to the country chart, she MUST do this.
Now, what about security of the raw data itself? Well, as you can see in the image above, nothing is listed in the DataSets section for her. This means a couple of things:
- She cannot access the data model to see the linkage
- There is no way to download the complete raw data set
Having said that, Q&A is enabled and – if you ask the right questions – you’ll be able to pull up the underlying data. The right question is essentially “show <table name” and it will show you all the records for the given table. Obviously, the bigger the data set and the more tables it has, the harder it is to make sense of it, but you CAN query it all at a raw record level, so you do want to be a bit selective about what data you include in the data set. Now, to be fair, you can enable row level security to restrict what the user has access to, but that’s a topic for another day.
Sharing Power BI Dashboards With an External Tenant
Now, even though I covered external sharing in my last post, it was targeted at public sharing. What about when you want to share your dashboard with specific people outside your organization. We can totally do this, although I find the experience a bit… wanting.
Now we can certainly share a dashboard with someone external to our company. We do it in the exact same manner as we would with someone inside the company. Namely we do the following:
- Select the Dashboard
- Click the Share icon
- Enter the email address
- Select the sharing options as desired
We are helpfully warned that this user is outside our tenant, which is great.
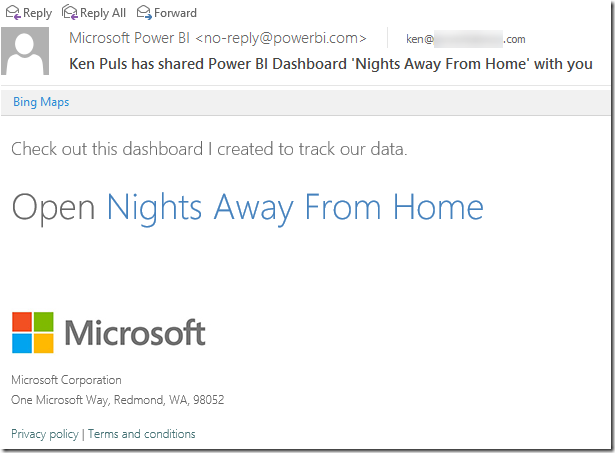
Now, what happens next is the user is sent an email which looks like this:
And when we click the link, we must sign in to get access to the dashboard. All good so far. The dashboard cross filters and, like when shared inside the company, you can click the Hotel Stays Page 1 portion to get to the report for further drilling. So far nothing seems off.
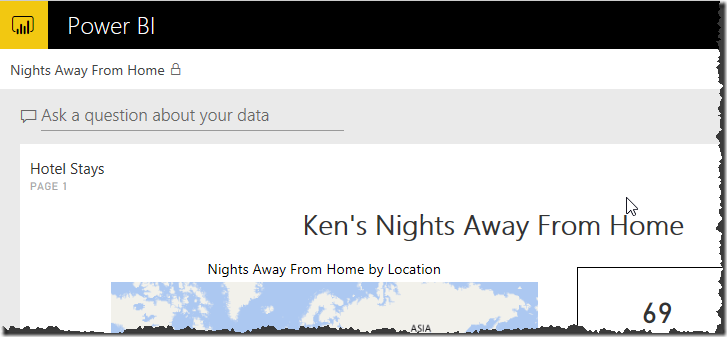
But now check this out… if I look at the top left corner of the screen, I see this:
Okay, so it’s not about what I see, but rather what I don’t. Notice the Power BI logo? It’s directly about the title. Where is the little icon to get to the rest of your Power BI reports? It’s not there at all. “No problem”, you’re thinking, “ just click the logo”. Sure thing…
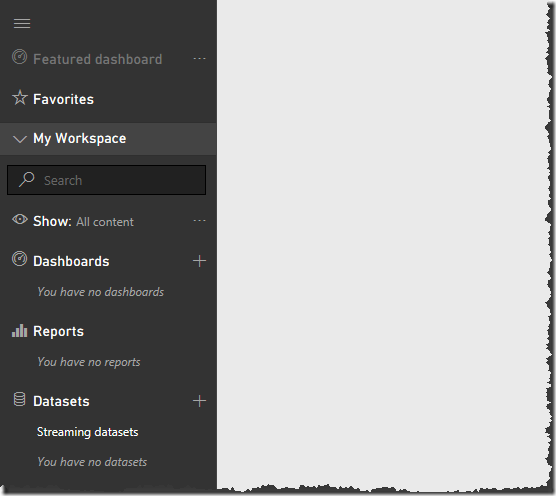
And you’re taken to a page that has this navigation structure. Notice anything missing? Um… like maybe the dashboard that was shared with me? (To be clear, any reports owned by this user from within their own company would show up here.)
This is a known thing, as documented in this article by Microsoft. And to save you the trouble of reading this, here’s the pertinent part:
When you share with people outside your organization, they get an email with a link to the shared dashboard. They have to sign in to Power BI to see the dashboard. If they don't have a Power BI account, they can create one after clicking the link.
After they sign in, they see the shared dashboard in its own browser window without the left navigation pane, not in their usual Power BI portal. They have to bookmark the link to access this dashboard in the future.
To be fair, it is an improvement over the original state where you couldn’t share with an external tenant at all. Having said that, it’s still unfinished and hopefully it wont’ be long until Microsoft gets back to dealing with this and plumbs externally shared dashboards into the Power BI portal properly.
Final Thoughts
Listen, I complain about the things that don’t make sense to me, but overall, let’s circle back on how incredible this is overall. Over the last five blog posts I’ve built a system which:
- Has a spreadsheet back end to capture my hotel stays
- Can be updated from the Excel app on my iPhone (or whatever phone you have)
- Automatically updates
- Is published to a public facing dashboard on the web
- Is shared with Q&A to users both inside and outside my company
That is freaking stellar. Period.

![image_thumb[21] image_thumb[21]](https://excelguru.ca/wp-content/uploads/2016/09/image_thumb21_thumb.png)

5 thoughts on “Sharing Power BI Dashboards”
Ken,
Excellent series of articles.
Helps clear the fog of how to share data using Power BI dashboards.
Hi Ken, hope you are well
I'm wondering if you'd be interested in continuing this to discuss the options available for sharing under the new licensing regime?
We need to distribute content to casual viewers and small groups and cannot get Pro Licences. Nor can we get PBI Premium or Report server. This is a serious shortcoming which I've written extensively on:
https://www.linkedin.com/pulse/microsoft-power-bi-how-latecomers-party-can-still-grab-anthony-newell
The export to PowerPoint is not the finished article yet and export to PDF is still in the pipeline
I'm not sure there are any obvious workarounds other than creating the output in Excel then distributing that to non pro licence holders
Hey Anthony,
Great article. I wish I had a better answer than this, but the only way I can think of dealing with this is to buy some Power BI pro licenses for "consumers". Basically, you'd still have your Authors create and share the report, but you'd share the "Consumer" accounts to try and bring down the costs. (So 1 author creates 10 reports for 10 different managers, but it only consumes 2 Power BI Pro licenses.)
It's hokey, but if the consumers are truly consumers, and their are no security issues with everyone seeing the same reports, then it will work.
Pingback: Creating Power BI Card Visuals - Excelguru
Pingback: Can users see my raw data in Power BI? - Excelguru