Some time ago I got an email from Alex asking me if there was a way to identify duplicates using Power Query, but without removing non-duplicate records in the process. This post explores how to do that.
Background
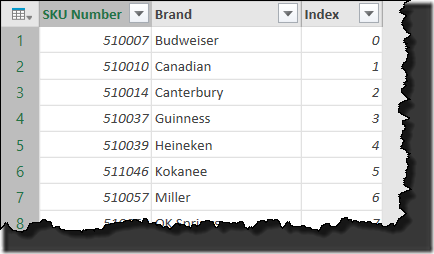
Suppose someone has given you a list like the one shown below (which you can download here if you’d like to follow along):
While multiple brands are okay here, we need a list that shows only unique SKU numbers. While the list provided to you was supposed to be duplicate free, you’re not 100% sure that it actually is. While it would be easy to just hit the SKU column with the Remove Duplicates function, you don’t want to do that. Instead you’d like to identify which records have duplicate entries in the list.
So how do we do this?
Naturally, there will be a few different ways to do this. I’m carving off one method that is the easiest to replicate via the user interface…
Step 1: Link to the Data
Of course we’ll start by pulling the data in to Power Query
- Click anywhere in the Products Table
- Create a new query –> From Table
The data will be loaded in to Power Query, and you’ll see two steps in the Applied Steps window:
- Source (pointing to your source data)
- Changed Type (setting the data types for the columns)
This might seem like an odd step right now, but we’re going to add a Index column to this table as well. The reason will become apparent later, but for now:
- To to Add Column –> Add Index Column –> From 0
Your data should now look like this:
Now we need to figure out how to flag any repeating SKU as a duplicate.
Step 2: Indentify Duplicates via Grouping Rows
The trick here is to use the Group By feature in Power Query, while preserving the relevant matching records.
NOTE: We cover the Grouping feature in Chapter 14 of M is for Data Monkey.
Here’s how we do this:
- Go to Transform –> Group By
- Set your Group By Options as follows:
- Group By: SKU Number
- New column name: Duplicates –> Count Rows
Next, click the + to the right of the “New Column Name” section to add another detail row. Set it up as follows:
-
- New column name: Duplicates –> All Rows
When you’re done, the dialog should look like this:
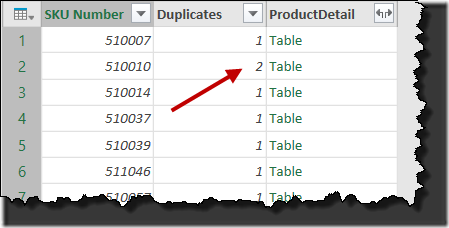
And upon clicking OK, the results will show that there are, indeed, items that show up more than once:
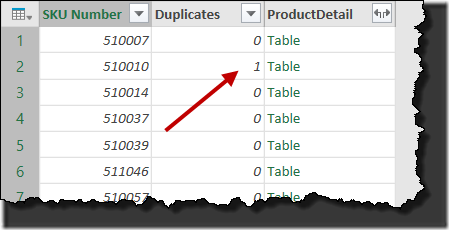
Let’s tweak this a bit, and subtract 1 from each value. That would give us a truer representation as to how many duplicates there are.
- Select the Duplicates column –> Transform –> Subtract –> 1
Resulting in the following:
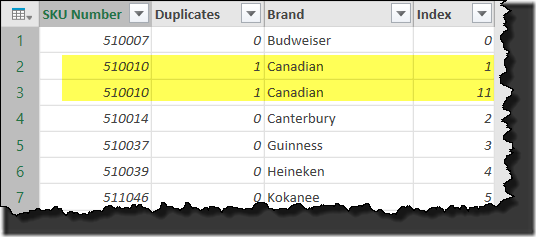
Much better. We’re now seeing that SKU 510010 appears to have 1 duplicate entry in the data set.
But there is still an issue here. When we grouped our records, we lost both the Brand names column, but also any duplicate records. Since the whole point of this exercise was to Identify Duplicates but not remove the duplicate records, we’re still not in a good place.
Step 3: Identify Duplicates and Show Duplicate Records
Let’s fix this. Remember how we added a new step to show “All Rows” for the ProductDetail column? That step gave us the ability to do something pretty cool… it gave us the ability to get back all the lost records and product detail information we’re currently missing.
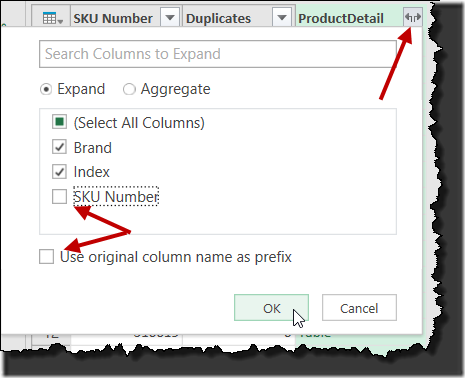
- Click the Expand button at the top right of the ProductDetail column
- Uncheck the SKU Number option (as we already have it)
- Uncheck the option to “Use original column name as prefix”
As you can see, this will bring back all the details we lost earlier.
Step 4: Final Cleanup
But hang on a second. Let’s look at this output a bit more closely…
Notice, that it re-sorted the data. That’s not exactly a desirable outcome, as we are trying to flag duplicates for a reason. Maybe we want to know where they exist in an inventory count or we have some other reason for wanting to preserve the original sort order of our data. It’s for this reason that we added the Index column earlier. That came through with the All Rows step, so let’s put our data back into its original order.
- Click the drop down arrow on the Index column –> Sort Ascending
- Right click the Index column –> Remove
And we can now finalize the query:
- Rename the query to ShowDuplicates
- Go to Home –> Close & Load
Step 5: Make the Duplicates Obvious
With the data now in an Excel table, we can make the duplicates even more obvious by applying some conditional formatting to the table. To do this:
- Select all the values in the Duplicates column of the table
- Go to Home –> Conditional Formatting –> Data Bars –> Choose a colour
I chose blue data bars, which makes the data look like this:
Conclusion
Our goal is now complete. We were able to identify duplicates and flag them without removing non-duplicate items. In addition, we have preserved the original order of the data in case that was important to us for any reason.





31 thoughts on “Identify Duplicates Using Power Query”
Awesome!
Ken,
Nice response. After leaving my question for you I had developed a Power Query solution for identifying duplicates which I was planning to share back. It meets my needs exactly, but is VERY clumsy - your solution is far more elegant (I had not yet learned about how to use "All Rows" in a Group column - but NOW I get it).
One of the things I was trying to do was to not only identify all the dupes, but to identify ONE of the dupes as the primary (e.g. the most recent record, or the oldest record, from a specific source, etc.) for subsequent analysis.
I hope to apply your approach to my specific problem and share-back the result. Thanks for a great post.
Cool stuff, Alex. Glad you found it useful!
Ted Murphy also sent me an alternate version of identifying duplicates. To see how he accomplished the task:
-Create a new blank query
-Go to the Advanced Editor and replace all code with the following:
let
Source = Excel.CurrentWorkbook(){[Name="Products"]}[Content],
#"Teds Link" = Table.TransformColumnTypes(Source,{{"SKU Number", Int64.Type}, {"Brand", type text}}),
#"Grouped Rows" = Table.Group(#"Teds Link", {"SKU Number"}, {{"Duplicates", each Table.RowCount(_), type number}}),
Duplicates = Table.SelectRows(#"Grouped Rows", each ([Duplicates] > 1)),
#"Merged Queries" = Table.NestedJoin(#"Teds Link",{"SKU Number"},Duplicates,{"SKU Number"},"NewColumn",JoinKind.LeftOuter),
#"Expanded NewColumn" = Table.ExpandTableColumn(#"Merged Queries", "NewColumn", {"Duplicates"}, {"Duplicates"}),
#"Reordered Columns" = Table.ReorderColumns(#"Expanded NewColumn",{"SKU Number", "Duplicates", "Brand"})
in
#"Reordered Columns"
-Click through the steps to take a look at the differences
Pingback: Excel Roundup 20151214 « Contextures Blog
I may be missing something, but wouldn't it be a lot easier to highlight the sku column, choose conditional formatting, click highlight cell rules and then duplicate values.
Hi Gary,
I guess it kind of depends on the purpose. If you just want to see them, yes. But what if you need these values to drive a whole list for another report?
The true game here isn't strictly the fact that we can see them, it's that we have a listing that we can feed into a PivotTable or Power Pivot for further use.
Ken, if you've tried the new Show Duplicates button in the March 2016 Power BI Desktop, it is just using a multistep Power Query in one line. Pretty neat, and could be modified as a custom function for regular PQ. It works for more than one column selected. Here is a prettified version:
#"Kept Duplicates" =
let
columnNames = {"Hour", "City"},
addCount = Table.Group(#"Changed Type", columnNames, {{"Count", Table.RowCount, type number}}),
selectDuplicates = Table.SelectRows(addCount, each [Count] > 1),
removeCount = Table.RemoveColumns(selectDuplicates, "Count")
in
Table.Join(#"Changed Type",columnNames, removeCount, columnNames, JoinKind.Inner)
Well now that is cool. I haven't tried yet, no. Hasn't shown up in Excel yet. (Hopefully it will make Excel next month!)
Thank you for sharing this blog post on identifying duplicates! I was not aware of the "All Rows" option in a Group by column either - so wonderful!
I am looking forward to reading more of your blogs and reading your book - M is for Data Monkey.
Hi Judith,
In more recent versions of Power Query this is even easier, as there is now a Keep Duplicates option that avoids the need for this. But still good to have this tool in the toolbox!
Ken - are you referring to Power Query in Excel? I am using the Power BI Desktop app and do not see a feature to Keep Duplicates.
Ken - I went and read the March 2016 release notes and found that it is a toggle button tied to the Remove Duplicates button - this is great and faster - thank you!
Ken, this is really cool. I'm using a slight variation to compare a 'Master' list that gets updated daily against an 'Extract' list that has additional notes, so that it only returns new records from the Master list that aren't currently in the Extract list. i.e. I check for duplicates, and only keep items with no duplicates. I can then paste those new rows into my Extract list, and add whatever notes I need to.
PowerQuery is way cool.
I Have Date in Two Sheets eg: sheet 1 and sheet 2. In that i want to find the Duplicates. Not Separately
You'll need to merge the two sheets together first (or append them), then search for duplicates.
Hello Ken,
I'm trying to find solution for filter duplicates. It's easy when need to be done in one table. But I'm trying to leave rows in table 2 which I already have in table 1.
For example:
Table 1
Column 1 | Column 2
A | 1
B | 1
C | 1
D | 1
Table 2
Column 1 | Column 2
E | 2
B | 1
C | 1
F | 2
I want to modify/filter Table 2 and to have just these rows which are not apear in Table 1.
In example above Table 2 need to looks like:
Column 1 | Column 2
E | 2
F | 2
Is it possible to do that?
Best regards
Todor Todorov
You bet it is Todor. Check out this article: https://excelguru.ca/2015/12/23/merge-tables-using-inner-and-anti-joins-in-power-query/
Fantastic! Clear and easy to follow, worked perfectly. Thanks!
Hi Sam, glad to hear it worked for you. Thanks for reading our blog!
Learned something new:)
Again not a day lost.
Super! thank you so much for this solution!
This was exactly what I've been looking for. Question on a couple modifications to this.
1) Rather than do the subtract 1 to all the duplicate counts I have another column that shows whether one of the SKUs is in use or not. I'd love a way to check for in-use and subtract that from the duplicate SKUs that may have one
2) During the expand all columns is there a way to do that that doesn't bring back the duplicates but just expands the columns? Or do I need to just go back and remove duplicates after that fact?
Thanks a lot
Hi Jason,
I'm not totally following on number 1, to be honest. Maybe you could do this by merging records from a table that is in use?
On number 2, the challenge is that - if you expand the table - you'll get all rows again. But here's a little trick you can use. When grouping, don't choose ALL Rows, but rather, for each column you want, choose "Max" of the Textual column. It will bring back the textual record, eliminating the need to expand it.
Hi Ken,
I'm not seeing the subtract option on the Transform. There is Round, Absolute Value, Factorial, etc but no subtract or add. I'm missing something here.
Hi Angela,
Those are buried under the "Standard" button. 🙂
Hi Ken,
Fantastic! It helped me a lot.
Is there any way that we can replace 2nd occurrence with null or blank? I'm dealing with numbers. I would like to keep the first occurrence but replaced the rest with null or blanks.
Thanks so much.
Hi Rya, have a look here: https://excelguru.ca/2020/01/13/unfill-in-power-query/
This is absolutely fantastic!! I have searched high and low for a solution like this for M code and you nailed it! Great presentation of it as well, was very easy to follow and I now know how M code/Power Query Editor thinks (at least some what better). Thanks for sharing this!
Pingback: Unfill in Power Query - Excelguru
Pingback: Label Duplicates with Power Query - Excelguru